UNITED STATES
SECURITIES AND EXCHANGE COMMISSION
Washington, D.C. 20549
____________________________________
FORM 10-K
|
| |
☒
| ANNUAL REPORT PURSUANT TO SECTION 13 OR 15(d) OF THE SECURITIES EXCHANGE ACT OF 1934 |
For the fiscal year ended December 31, 2017
OR
|
| |
☐
| TRANSITION REPORT PURSUANT TO SECTION 13 OR 15(d) OF THE SECURITIES EXCHANGE ACT OF 1934 |
For the transition period from to
Commission File Number 001-06605
____________________________________
EQUIFAX INC.
(Exact name of registrant as specified in its charter) |
| | |
Georgia | | 58-0401110 |
(State or other jurisdiction of incorporation or organization) | | (I.R.S. Employer Identification No.) |
1550 Peachtree Street, N.W. | | |
Atlanta, Georgia | | 30309 |
(Address of principal executive offices) | | (Zip Code) |
Registrant’s telephone number, including area code: 404-885-8000
Securities registered pursuant to Section 12(b) of the Act:
|
| | |
Title of each class | | Name of each exchange on which registered |
Common Stock, $1.25 par value per share | | New York Stock Exchange |
Securities registered pursuant to Section 12(g) of the Act: None.
____________________________________
Indicate by check mark if Registrant is a well-known seasoned issuer, as defined in Rule 405 of the Securities Exchange Act (“Act”). ☒ YES ☐ NO
Indicate by check mark if Registrant is not required to file reports pursuant to Section 13 or Section 15(d) of the Act. ☐ YES ☒ NO
Indicate by check mark whether Registrant (1) has filed all reports required to be filed by Section 13 or 15(d) of the Securities Exchange Act of 1934 during the preceding 12 months (or for such shorter period that the Registrant was required to file such reports), and (2) has been subject to such filing requirements for the past 90 days. ☒ YES ☐ NO
Indicate by check mark whether the Registrant has submitted electronically and posted on its corporate Web site, if any, every Interactive Data File required to be submitted and posted pursuant to Rule 405 of Regulation S-T during the preceding 12 months (or for such shorter period that the Registrant was required to submit and post such files). YES ☒ NO ☐
Indicate by check mark if disclosure of delinquent filers pursuant to Item 405 of Regulation S-K is not contained herein, and will not be contained, to the best of Registrant’s knowledge, in definitive proxy or information statements incorporated by reference in Part III of this Form 10-K or any amendment to this Form 10-K. ☐
Indicate by check mark whether the Registrant is a large accelerated filer, an accelerated filer, a non-accelerated filer, a smaller reporting company, or an emerging growth company. See definitions of “large accelerated filer,” “accelerated filer,” “smaller reporting company” and "emerging growth company" in Rule 12b-2 of the Exchange Act. (Check one): |
| | | | | | | | |
☒ Large accelerated filer | | ☐ Accelerated filer | | ☐ Non-accelerated filer | | ☐ Smaller reporting company | | ☐ Emerging growth company |
| | | (Do not check if a smaller reporting company) | | | |
If an emerging growth company, indicate by check mark if the registrant has elected not to use the extended transition period for complying with any new or revised financial accounting standards provided pursuant to Section 13(a) of the Exchange Act. ☐
Indicate by check mark whether the Registrant is a shell company (as defined in Rule 12b-2 of the Act). ☐ YES ☒ NO
As of June 30, 2017, the aggregate market value of Registrant’s common stock held by non-affiliates of Registrant was approximately $16,541,237,155 based on the closing sale price as reported on the New York Stock Exchange. At January 31, 2018, there were 120,123,872 shares of Registrant’s common stock outstanding.
DOCUMENTS INCORPORATED BY REFERENCE
Portions of Registrant’s definitive proxy statement for its 2018 annual meeting of shareholders are incorporated by reference in Part III of this Form 10-K.
TABLE OF CONTENTS
PART I
ITEM 1. BUSINESS
OVERVIEW
Equifax Inc. is a leading global provider of information solutions and human resources business process outsourcing services for businesses, governments and consumers. We have a large and diversified group of clients, including financial institutions, corporations, governments and individuals. Our services are based on comprehensive databases of consumer and business information derived from numerous sources including credit, financial assets, telecommunications and utility payments, employment, income, demographic and marketing data. We use advanced statistical techniques and proprietary software tools to analyze all available data, creating customized insights, decision-making solutions and processing services for our clients. We help consumers understand, manage and protect their personal information and make more informed financial decisions. We also provide information, technology and services to support debt collections and recovery management. Additionally, we are a leading provider of payroll-related and human resource management business process outsourcing services in the United States of America, or U.S.
We currently operate in four global regions: North America (U.S. and Canada), Asia Pacific (Australia and New Zealand), Europe (the United Kingdom, or U.K., Spain and Portugal) and Latin America (Argentina, Chile, Costa Rica, Ecuador, El Salvador, Honduras, Mexico, Paraguay, Peru and Uruguay). We maintain support operations in the Republic of Ireland. We also offer Equifax branded credit services in Russia and India through joint ventures, have investments in consumer and/or commercial credit information companies through joint ventures in Cambodia, Malaysia, Singapore and Dubai, and have an investment in a consumer and commercial credit information company in Brazil.
Equifax was originally incorporated under the laws of the State of Georgia in 1913, and its predecessor company dates back to 1899. As used herein, the terms Equifax, the Company, we, our and us refer to Equifax Inc., a Georgia corporation, and its consolidated subsidiaries as a combined entity, except where it is clear that the terms mean only Equifax Inc.
We are organized and report our business results in four operating segments, as follows:
| |
• | U.S. Information Solutions (USIS) — provides consumer and commercial information solutions to businesses in the U.S. including online information, decisioning technology solutions, fraud and identity management services, portfolio management services, mortgage reporting and financial marketing services. |
| |
• | International —which includes our Asia Pacific, Europe, Canada and Latin America business units, provides products and services similar to those available in the USIS operating segment but with variations by geographic region. We also provide information, technology and services to support debt collections and recovery management. |
| |
• | Workforce Solutions — provides services enabling clients to verify income and employment (Verification Services) as well as to outsource and automate the performance of certain payroll-related and human resource management business processes, including unemployment cost management, tax credits and incentives and I-9 management services and services to allow employers to ensure compliance with the Affordable Care Act (Employer Services). |
| |
• | Global Consumer Solutions — provides products to consumers in the United States, Canada, and the U.K., enabling them to understand and monitor their credit and monitor and help protect their identity. We also sell consumer and credit information to resellers who combine our information with other information to provide direct to consumer monitoring, reports and scores. |
2017 Cybersecurity Incident
Background. In fiscal 2017, we experienced a cybersecurity incident following a criminal attack on our systems that involved the theft of certain personally identifiable information of U.S., Canadian and U.K. consumers. Criminals exploited a U.S. website application vulnerability to gain unauthorized access to our network. Based on our forensic investigation, the unauthorized access of information occurred from mid-May through July 2017. The information accessed primarily includes names, Social Security numbers, birth dates, addresses and, in some instances, driver’s license numbers. In addition, credit card numbers for approximately 209,000 U.S. and Canadian consumers, and certain dispute documents with personal identifying information for approximately 182,000 U.S. consumers, were accessed. The investigation determined that personal information
of approximately 19,000 Canadian consumers was impacted and approximately 860,000 potentially affected U.K. consumers were contacted regarding access to personal information. The forensic investigation of the cybersecurity incident was, as previously disclosed, completed in the fourth quarter of fiscal 2017. No evidence was found that the Company's core consumer, employment and income, or commercial credit reporting databases were accessed.
The Company acted promptly to notify the approximately 145.5 million U.S. consumers whose personally identifiable information the Company had identified in 2017 as potentially accessed. As a result of an ongoing analysis of data stolen in the 2017 cybersecurity incident, the Company recently announced that it was able to identify approximately 2.4 million U.S. consumers whose name and partial driver’s license information were stolen, but who were not in the affected population of approximately 145.5 million consumers previously identified by the Company in 2017. The Company is in the process of notifying these additional consumers.
As a result of the 2017 cybersecurity incident, we are party to numerous lawsuits and governmental investigations. See Item 1A. Risk Factors and Item 3. Legal Proceedings for more information regarding these lawsuits and investigations. We continue to cooperate with law enforcement in connection with the criminal investigation into the actors responsible for the cybersecurity incident.
Regaining Trust. The Company has taken and continues to take extensive steps designed to prevent this type of incident from happening again and to earn back the trust of consumers, customers and regulators.
Upon discovery of the unauthorized access, we acted immediately to stop the intrusion and promptly engaged a leading, independent cybersecurity firm to conduct a comprehensive forensic investigation to determine the scope of the intrusion, including the specific data potentially impacted. We have continued to analyze the data impacted, including through the use of external data providers, to identify and inform consumers who may have been impacted by this incident.
Following the cybersecurity incident, we began undertaking significant steps to enhance our data security infrastructure. In connection with these efforts, we have incurred significant costs and expect to incur additional significant costs as we take further steps to prevent unauthorized access to our systems and the data we maintain. The actions we have taken are based on our investigation of the causes of the cybersecurity incident, but there will be additional changes needed to prevent a similar incident. We have also enhanced our disclosure controls and procedures and related protocols to specifically provide that cyber incidents are promptly escalated and investigated and reported to senior management, and where appropriate, to the Board of Directors. We also engaged an independent outside consulting firm to help us with both strategic remediation activities and to review our cybersecurity framework, our controls framework and our management and employees' roles and responsibilities.
In the third and fourth quarters of 2017, our Board made strategic changes to our executive leadership team and added an independent director to our Board with highly-relevant skills in data security. Our Board also formed a Special Committee to conduct an independent review of the cybersecurity incident, the Company’s response to it and all relevant policies and practices. The Special Committee's investigation was undertaken with the assistance of outside professionals engaged by the Special Committee.
The Company has also taken action to provide consumers with new tools to protect credit data. Immediately following the announcement of the breach, the Company devoted substantial resources to consumer notifications and launched and continuously enhanced multi-faceted consumer resources, including making its TrustedID Premier service, an identity theft protection and credit file monitoring product, available for free to all U.S. consumers for 12 months for those who signed up by January 31, 2018. Similarly, for consumers impacted by the cybersecurity incident in Canada and the U.K., we are providing free credit reports and scores, credit monitoring and identity theft protection for 12 months for those consumers who signed up by January 31, 2018. As part of our commitment to providing long-term resources and protections for consumers, in January 2018, the Company introduced Lock & AlertTM, a new service that allows U.S. consumers to quickly lock and unlock their Equifax credit report for free, for life. We believe this is a meaningful step toward fulfilling our commitment to give consumers the power to protect and control access to personal credit data.
OUR BUSINESS STRATEGY
Data is at the core of our value proposition and the protection and safeguarding of that information is paramount. Our strategic objective is to be the global leader in information solutions that creates unparalleled insights to solve customer challenges. Leveraging our extensive resources, we deliver differentiated decisions through a broad and diverse set of data assets, sophisticated analytics and proprietary decisioning technology. Our long-term corporate strategy is driven by the following imperatives:
| |
• | Serve as a trusted steward and advocate for consumers and our customers. This includes protecting and safeguarding the information we have using advanced data security tools, techniques and processes in order to protect consumer specific information from fraudulent access. We also strive to continuously improve the consumer and customer experience in our consumer and commercial offerings, anticipating and executing on regulatory initiatives, while simultaneously delivering industry leading security for our services. |
| |
• | Deliver consistently strong profitable growth and shareholder returns. We seek to enhance shareholder value through disciplined execution of our strategic initiatives and by positioning ourselves as a premier and trusted provider of high value information solutions. |
| |
• | Develop unparalleled analytical insights leveraging Equifax unique data. We continue to invest in and acquire unique sources of credit and non-credit information to enhance the variety and quality of our services while increasing clients’ confidence in information-based business decisions. Areas of focus for investment in new sources of data include, among others, positive payment data, fraud and personal identification data, real estate data and new commercial business data. We also have developed unique capabilities to integrate customer and third-party data into our solution offerings to further enhance the decisioning solutions we develop for our customers. |
We continue to invest in and develop new technology to enhance the security, functionality and cost-effectiveness of the services we offer and further differentiate our products from those offered by our competitors. In addition to custom products for large clients, we develop software as a service based, decisioning and data access technology platforms that are cost effective for clients of all sizes. We also develop predictive scores and analytics, some of which leverage multiple data assets, to help clients acquire new customers and manage their existing customer relationships. We develop a broad array of industry, risk management, cross-sell and account acquisition models to enhance the precision of our clients’ decisioning activities. We also develop custom and generic solutions that enable customers to effectively manage their debt collection and recovery portfolios.
| |
• | Innovate for market leadership in key domains and verticals. We seek to increase our share of clients’ spend on information-related services through developing and introducing new products, pricing our services in accordance with the value they represent to our customers, increasing the range of current services utilized by our clients, and improving the quality and effectiveness of our sales organization and client support interactions with consumers. We are also helping clients address increased requirements to comply with emerging regulations and rules. |
We believe there are many opportunities to expand into emerging markets both in the U.S. and internationally. In the U.S., we have increased and broadened resources in key markets, including financial, mortgage, auto, insurance, telecommunications, healthcare and government, and we are delivering services ranging from identity authentication to risk management. We continue to invest in growing our ventures in Russia and India and leveraging our newer product offerings across all of our geographical business units and periodically enter new country markets through acquisitions or start-up operations.
| |
• | Invest in talent to drive our strategy and foster a culture of innovation. We attract top talent by continuing to expand and diversify our talent pipeline. We regularly undertake various talent initiatives to engage, develop, and retain our top talent. |
MARKETS AND CLIENTS
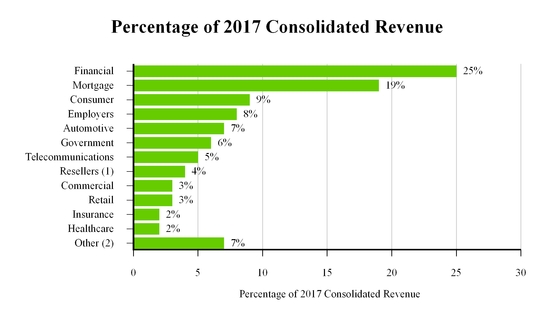
Our products and services serve clients across a wide range of verticals, including financial services, mortgage, employers, consumer, commercial, telecommunications, retail, automotive, utilities, brokerage, healthcare and insurance industries, as well as state and federal governments. We also serve consumers directly. Our revenue stream is highly diversified with our largest client providing less than 3% of total revenue. The following table summarizes the various end-user markets we serve:
| |
(1) | Predominantly sold to companies who serve the direct to consumer market and includes other small end user markets. |
| |
(2) | Other includes revenue from other miscellaneous end-user markets. |
We market our products and services primarily through our own direct sales organization that is structured around sales teams that focus on client segments typically aligned by vertical markets and geography. Sales groups are based in our headquarters in Atlanta, Georgia, and field offices located in the U.S. and in the countries where we have operations. We also market our products and services through indirect channels, including alliance partners, joint ventures and other resellers. In addition, we sell through direct mail and the internet.
Our largest geographic market segments are the U.S.; Asia Pacific (Australia and New Zealand); Europe (the U.K., Spain and Portugal); Canada; and Latin America (Argentina, Chile, Costa Rica, Ecuador, El Salvador, Honduras, Mexico, Paraguay, Peru and Uruguay). We maintain support operations in the Republic of Ireland. We also offer Equifax branded credit services in Russia and India through joint ventures, have investments in consumer and/or commercial credit information companies through joint ventures in Cambodia, Malaysia, Singapore and Dubai, and have an investment in a consumer and commercial credit information company in Brazil. We also provide information, technology and services to support debt collections and recovery management in Asia Pacific, Europe, Canada and Latin America.
Revenue from international clients, including end users and resellers, amounted to 29% of our total revenue in 2017, 27% of our total revenue in 2016 and 23% of our total revenue in 2015.
PRODUCTS AND SERVICES
Our products and services help our clients make more informed decisions with higher levels of confidence by leveraging a broad array of data assets. Analytics are used to derive insights from the data that are most relevant for the client’s decisioning needs. The data and insights are then processed through proprietary software and transmitted to the client’s operating system to execute the decision.
The following chart summarizes the key products and services offered by each of the business units within our segments:
|
| | | | | | | | | | | | | | | | | | | | |
| | | | | | | | | | | | | | | | | | | | |
| USIS | | International | | | | Workforce Solutions | | | |
| Online Information Solutions | | Financial Marketing Services | | Mortgage Services | | Europe | | Asia Pacific | | Latin America | | Canada | | Verification Services | | Employer Services | | Global Consumer Solutions | |
Online data | X | | | | X | | X | | X | | X | | X | | X | | | | X | |
Portfolio management services | X | | X | | X | | X | | X | | X | | X | | X | | | | | |
Analytical services | X | | X | | X | | X | | X | | X | | X | | X | | X | | X | |
Technology services | X | | | | X | | X | | X | | X | | X | | | | | | | |
Identity management and fraud | X | | | | | | X | | X | | X | | X | | X | | | | X | |
Marketing Services | | | X | | X | | | | X | | X | | X | | | | | | | |
Direct to consumer credit monitoring | | | | | | | | | X | | | | | | | | | | X | |
Employment and income verification services | | | | | | | | | X | | | | | | X | | | | | |
Business process outsourcing (BPO) | | | | | | | | | X | | | | | | X | | X | | | |
Debt collection software, services and analytics | | | | | | | X | | X | | X | | X | | | | | | | |
Each of our operating segments is described more fully below. For the operating revenue, operating income and total assets for each segment see Note 13 of the Notes to the Consolidated Financial Statements in this report.
USIS
USIS provides consumer and commercial information solutions to businesses in the U.S. through three product and service lines, as follows:
Online Information Solutions. Online Information Solutions’ products are derived from multiple large and comprehensive databases of consumer and commercial information that we maintain about individual consumers and businesses, including credit history, current credit status, payment history and address information. Our clients utilize the information and analytical insights we provide to make decisions for a broad range of financial and business purposes, such as whether, and on what terms, to approve auto loans or credit card applications, and whether to allow a consumer or a business to open a new utility or telephone account. In addition, this information is used by our clients for cross selling additional products to existing customers, improving their underwriting and risk management decisions, and authenticating and verifying consumer and business identities. We also sell consumer and credit information to resellers who combine our information with other information to provide services to the financial, mortgage, fraud and identity management, and other end-user markets. Our software platforms and analytical capabilities can integrate all types of information, including third-party and client information, to enhance the insights and decisioning process to help further mitigate the risk of granting credit, predict the risk of bankruptcy, indicate the applicant’s risk potential for account delinquency, ensure the identity of the consumer, and reduce exposure to fraud. These risk management services enable our clients to monitor risks and opportunities and proactively manage their portfolios.
Online Information Solutions’ clients access products through a full range of electronic distribution mechanisms, including direct real-time access, which facilitates instant decisions. We also develop and host customized applications that enhance the decision-making process for our clients. These decisioning technology applications assist with a wide variety of decisioning activities, including determining pre-approved offers, cross-selling of various products, determining deposit amounts for telephone and utility companies, and verifying the identity of their customers. We have also compiled commercial databases regarding businesses in the U.S., which include loan, credit card, public records and leasing history data, trade accounts receivable performance, and Secretary of State and Securities and Exchange Commission registration information. We offer scoring and analytical services that provide additional information to help mitigate the credit risk assumed by our clients.
Mortgage Solutions. Our Mortgage Solutions products, offered in the U.S., consist of specialized credit reports that combine information from the three major consumer credit reporting agencies (Equifax, Experian Group and TransUnion) into a single “merged” credit report in an online format, commonly referred to as a tri-merge report. Mortgage lenders use these tri-merge reports in making their mortgage underwriting decisions. Additionally, we offer various “triggering” services designed to alert lenders to changes in a consumer’s credit status during the underwriting period and securitized portfolio risk assessment services for evaluating inherent portfolio risk.
Financial Marketing Services. Our Financial Marketing Services products utilize consumer and commercial financial information enabling our clients to more effectively manage their marketing efforts, including targeting and segmentation, to identify and acquire new clients for their products and services; to develop portfolio strategies to minimize risk and maximize
profitability; and to realize additional revenue from existing customers through more effective cross selling and upselling of additional products and services. These products utilize information derived from consumer and commercial information, including credit, income, asset, liquidity, net worth and spending activity, which also support many of our Online Information Solutions’ products. These data assets broaden the understanding of consumer and business financial potential and opportunity which can further drive high value decisioning and targeting solutions for our clients. We also provide account review services, which assist our clients in managing their existing customers and prescreen services that help our clients identify new opportunities with their customers. Clients for these products primarily include institutions in the banking, brokerage, retail, insurance and mortgage industries as well as companies primarily focused on digital and interactive marketing.
International
The International operating segment includes our Asia Pacific, Europe, Latin America and Canada business units. These business units offer products that are similar to those available in the USIS operating segment, although, in some jurisdictions, data sources tend to rely more heavily on government agencies than in the U.S. We also offer specialized services that help our customers better manage risk in their consumer portfolios. This operating segment’s products and services generate revenue in Argentina, Australia, Canada, Chile, Costa Rica, Ecuador, El Salvador, Honduras, Mexico, New Zealand, Paraguay, Peru, Portugal, Spain, the U.K. and Uruguay. We also maintain support operations in the Republic of Ireland, Chile and Costa Rica. We offer consumer credit services in Russia and India through investments in joint ventures, have investments in consumer and/or commercial credit information companies through joint ventures in Cambodia, Malaysia, Singapore and Dubai, and have an investment in the second largest consumer and commercial credit information company in Brazil. We also provide information, technology and services to support debt collections and recovery management in Asia Pacific, Europe, Canada and Latin America.
Europe. Our European operation provides information solutions, marketing and personal solutions products. Information solutions and personal solutions products are generated from information that we maintain and include credit reporting and scoring, asset information, risk management, identity management and authentication services, fraud detection and modeling services. Most of these products are sold in the U.K. with a more limited set of information solutions products sold in Portugal and Spain. Our commercial products, such as business credit reporting and commercial risk management services, are available mostly in the U.K, with a more limited set of information solutions products sold in Portugal and Spain. Marketing products, which are similar to those offered in our Financial Marketing Services business unit, are primarily available in the U.K. and, to a lesser extent, in Spain. We also provide information, technology and services to support debt collections and recovery management.
Asia Pacific. Our Asia Pacific operation provides consumer and commercial information solutions products, marketing products and personal solutions products. We offer a full range of products, generated from credit records, including credit reporting and scoring, decisioning technology, risk management, identity management, authentication and fraud detection services. Our consumer and commercial products are the primary source of revenue in each of the countries in which we operate and include credit reporting, decisioning tools and risk management services. We also provide information, technology and services to support debt collections and recovery management. Additionally, we provide a variety of consumer and commercial marketing products generated from credit information databases, including business profile analysis, business prospect lists and database management. The countries in which we operate include Australia and New Zealand, as well as through joint ventures in Cambodia, Malaysia, Singapore and Dubai.
Latin America. Our Latin American operation provides consumer and commercial information solutions products, marketing products and personal solutions products. We offer a full range of products, generated from credit records that we maintain, including credit reporting and scoring, decisioning technology, risk management, identity management, authentication and fraud detection services. Our consumer products are the primary source of revenue in each of the countries in this region in which we operate. We also offer various commercial products, which include credit reporting, decisioning tools and risk management services, in the countries we serve. We also provide information, technology and services to support debt collections and recovery management. Additionally, we provide a variety of consumer and commercial marketing products generated from our credit information databases, including business profile analysis, business prospect lists and database management. The countries in this region in which we operate include Argentina, Chile, Costa Rica, Ecuador, El Salvador, Honduras, Mexico, Paraguay, Peru and Uruguay.
Canada. Similar to Online Information Solutions, Mortgage Solutions and Financial Marketing Services business units, Canada offers products derived from the credit information that we maintain about individual consumers and businesses. We offer many products in Canada, including credit reporting and scoring, consumer and commercial marketing, risk management, fraud detection and modeling services, identity management and authentication services, together with certain of
our decisioning products that facilitate pre-approved offers of credit and automate a variety of credit decisions. We also provide information, technology and services to support debt collections and recovery management in Canada.
Workforce Solutions
Workforce Solutions operates in the U.S. through two business units:
Verification Services. Verification Services include employment and income verification services. Our online verification services enable direct third-party verifiers including various governmental agencies, mortgage originators, credit card and automotive lenders and pre-employment screeners to verify the employee’s employment status and income information. We also offer an offline research verification service, which expands employment verification to locate data outside our existing automated database.
Employer Services. These services are aimed at reducing the cost to the human resources function of businesses through a broad suite of services including assisting with employment tax matters designed to reduce the cost of unemployment claims through effective claims representation and management and efficient processing and to better manage the tax rate that employers are assessed for unemployment taxes; comprehensive services designed to research the availability of employment-related tax credits (e.g., the federal work opportunity and welfare to work tax credits and state tax credits), and to process the necessary filings and assist the client in obtaining the tax credit; W-2 management services (which include initial distribution, reissue and correction of W-2 forms); paperless pay services that enable employees to electronically receive pay statement information as well as review and change direct deposit account or W-4 information; integrated electronic time capture and reporting services; paperless new-hire services to bring new workers on board using electronic forms; I-9 management services designed to help clients electronically comply with the immigration laws that require employers to complete an I-9 form for each new hire; and onboarding services using online forms to complete the new hire process for employees of corporate and government agencies. In addition we provide software and services to employers to assist in compliance with the Affordable Care Act ("ACA") through partnerships with government agencies.
The Work Number. The Work Number is our key repository of employment and income data serving our verifier business and enabling employer human resource services. We rely on payroll data received from over 10,600 organizations to regularly update the database. The updates occur as employers transmit data electronically to Equifax from their payroll systems. Employers contract to provide this data for specified periods under the terms of contracts which range from one to five years. We use this data to provide automated employment and income verification services to third-party verifiers as well as enabling employer services such as unemployment claims, I-9 and eVerify transactions and employer tax credits opportunities.
The fees we charge for these services are generally on a per transaction basis. We have not experienced significant turnover in the employer contributors to the database because we generally do not charge them to add their employment data to the database and the verification service we offer relieves them of the administrative burden and expense of responding to third-party employment verification requests. The database is approaching 330 million current and historic employment records at December 31, 2017.
Global Consumer Solutions
Our Global Consumer Solutions ("GCS") products give consumers information to enable them to understand and monitor their credit and monitor and help protect their identity primarily through our Equifax Complete, ID Patrol, Credit Watch and Score Watch monitoring products. Consumers can obtain credit file information about them and Equifax or FICO credit scores. Equifax products also offer monitoring features for consumers who are concerned about identity theft and data breaches, including credit report monitoring from all three bureaus, internet and bank account monitoring, lost wallet support, and the ability to lock and unlock the Equifax credit file. Our products are available to consumers in the U.S., Canada, and the U.K. directly primarily over the internet and indirectly through relationships with business partners who distribute our products or provide these services to their employees or customers. We also sell consumer and credit information to resellers who combine our information with other information to provide direct to consumer monitoring, reports and scores. Due to the 2017 cybersecurity incident, we have ceased advertising for new business as it relates to our U.S. consumer direct business and have now provided free services as discussed below.
Free Consumer Services
As part of our response to the cybersecurity incident announced in September 2017, we began offering in the U.S. our TrustedID Premier service, an identity theft protection and credit file monitoring product, for free to all consumers who signed up through January 31, 2018. Additionally, in January 2018, the Company introduced in the U.S., Lock & AlertTM, a new
service that allows customers to quickly lock and unlock their Equifax credit report for free, for life. Equifax also will provide the ability for U.S. consumers to freeze and unfreeze their Equifax credit file for free through June 30, 2018. We provide U.S. consumers with a free annual credit report in accordance with the FACT Act. For consumers impacted by the cybersecurity incident in Canada and the U.K., we are providing free credit reports and scores, credit monitoring and identity theft protection for 12 months for those consumers who signed up by January 31, 2018.
Seasonality
We experience seasonality in certain of our revenue streams. Revenue generated by the online consumer information services component of our USIS operating segment is typically the lowest during the first quarter, when consumer lending activity is at a seasonal low. Revenue generated from the Employer Services business unit within the Workforce Solutions operating segment is generally higher in the first quarter due primarily to the provision of Form W-2 preparation services which occur in the first quarter each year. Revenue generated from our financial wealth asset products and data management services in our Financial Marketing Services business is generally higher in the fourth quarter each year due to the significant portion of our annual renewals and deliveries which occur in the fourth quarter of each year.
COMPETITION
The market for our products and services is highly competitive and is subject to constant change. Our competitors vary widely in size and in the nature of the products and services they offer. Sources of competition are numerous and include the following:
| |
• | Competition for our consumer credit information solutions and personal solutions products varies by both application and industry, but generally includes two global consumer credit reporting companies, Experian and TransUnion, both of which offer a product suite similar to our credit information solutions. In the U.S., LifeLock is a national provider of personal identity theft protection service. Also, there are emerging competitors offering free credit scores including Credit Karma in the U.S. as well as CallCredit and ClearScore in the U.K. There are also a large number of competitors who offer competing products in specialized areas (such as fraud prevention, risk management and application processing and decisioning solutions) and software companies offering credit modeling services or analytical tools. Our differentiators include our unique data assets, decisioning technology and the features and functionality of our analytical capabilities. Our competitive strategy is to emphasize improved decision making and product quality while remaining competitive on price. Our marketing services products also compete with the foregoing companies and others who offer demographic information products, including Acxiom, Harte-Hanks and infoGROUP. We also compete with Fair Isaac Corporation with respect to certain of our analytical tools and solutions. |
| |
• | Competition for our commercial solutions products primarily includes Experian, Dun & Bradstreet and Cortera, and providers of these services in the international markets we serve. |
| |
• | Competition for our employment and income verification services includes large employers who serve their own needs through in-house systems to manage verification as well as regional online verification companies, such as Verify Jobs and First Advantage, who offer verification services along with other human resources ("HR") and tax services. Competition in the Verification Services market includes employers who manage verifications in-house, lenders who obtain verifications directly from employers, and online and offline verification companies, such as Verify Job System, Corporate Cost Control, Thomas & Thorngren and Employers Edge. Competition in the Employer Services market is diverse and includes in-house management of such services or the outsourcing of one or more of such services to HR consulting firms such as Mercer and Towers Watson, HR management services providers such as Oracle and Silk Road, payroll processors such as ADP and Ceridian, accounting firms such as PricewaterhouseCoopers and Ernst & Young, analytics companies such as Tableau and Visier and hundreds of smaller companies that provide one or multiple offerings that compete with our Employer Services business. |
| |
• | Competition for our debt collection and recovery management software, services and analytics is similar to the competition for our consumer credit information solutions. We believe that the breadth and depth of our data assets enable our clients to develop a more current and comprehensive view of consumers. In the category of platforms and analytics, we compete to some extent with entities that deploy collections platforms, account management systems or recovery solutions. |
While we believe that none of our competitors offers the same mix of products and services as we do, certain competitors may have a larger share of particular geographic or product markets or operate in geographic areas where we do not currently have a presence.
We assess the principal competitive factors affecting our markets to include: our ability to protect information; product attributes such as quality, depth, coverage, adaptability, scalability, interoperability, functionality and ease of use; product price; technical performance; access to unique proprietary databases; availability in application service provider, or ASP, format; quickness of response, flexibility and client services and support; effectiveness of sales and marketing efforts; existing market penetration; and new product innovation.
TECHNOLOGY AND INTELLECTUAL PROPERTY
We generally seek protection under federal, state and foreign laws for strategic or financially important intellectual property developed in connection with our business. Certain intellectual property, where appropriate, is protected by registration under applicable trademark laws or by prosecution of patent applications. We own a number of patents registered in the U.S. and several in foreign countries. We also have certain registered trademarks, service marks, logos and internet domain names in the U.S. and in many foreign countries, the most important of which are “Equifax,” “Decision360,” “The Work Number” and variations thereof. These marks are used in connection with many of our product lines and services. We believe that, in the aggregate, the rights under our patents and trademarks are generally important to our operations and competitive position, but we do not regard any of our businesses as being dependent upon any single patent or group of patents or trademark. However, certain Company trademarks, which contribute to our identity and the recognition of our products and services, including but not limited to the “Equifax” trademark, are an integral part of our business, and their loss could have a significant negative impact on us. We also protect certain of our confidential intellectual property and technology in compliance with trade secret laws and through the use of nondisclosure agreements.
We license other companies to use certain data, software, and other technology and intellectual property rights we own or control, primarily as core components of our products and services, on terms that are consistent with customary industry standards and that are designed to protect our interest in our intellectual property. Other companies license us to use certain data, technology and other intellectual property rights they own or control. For example, we license credit-scoring algorithms and the right to sell credit scores derived from those algorithms from third parties for a fee. We do not hold any franchises or concessions that are material to our business or results of operations.
GOVERNMENTAL REGULATION
We are subject to a number of U.S. federal, state, local and foreign laws and regulations that involve matters central to our business. These laws and regulations may involve privacy, data protection, intellectual property, competition, consumer protection, anti-corruption, anti-bribery, anti-money laundering, employment, health, taxation or other subjects. In particular, we are subject to U.S. federal, state, local and foreign laws regarding the collection, protection, dissemination and use of non-public personal information we have in our possession. Failure to satisfy those legal and regulatory requirements, or the adoption of new laws or regulations, could have a significant negative impact on our results of operations, financial condition or liquidity.
U.S. federal, state, local and foreign laws and regulations are evolving and can be subject to significant change. In addition, the application and interpretation of these laws and regulations are often uncertain. These laws are enforced by federal, state and local regulatory agencies in the jurisdictions where we operate, and in some instances also through private civil litigation. There are also a number of legislative proposals pending before the U.S. Congress, various state legislative bodies, and foreign governments concerning consumer and data protection that could affect us.
Summary of U.S. Regulation Relating to Consumer and Data Protection
Our U.S. operations are subject to numerous laws and regulations governing the collection, protection and use of consumer credit and other information, and imposing sanctions for the misuse of such information or unauthorized access to data. Many of these provisions also affect our customers’ use of consumer credit or other data we furnish.
Examples of the most significant of these laws include, but are not limited to, the following:
Federal Laws and Regulation
| |
• | FCRA - The Fair Credit Reporting Act (“FCRA”) regulates consumer reporting agencies, including us, as well as data furnishers and users of consumer reports such as banks and other companies. FCRA provisions govern the accuracy, fairness and privacy of information in the files of consumer reporting agencies (“CRAs”) that engage in the practice of assembling or evaluating certain information relating to consumers for certain specified purposes. The FCRA limits the type of information that may be reported by CRAs, limits the distribution and use of consumer reports and establishes consumer rights to access and dispute their credit files. CRAs are required to follow reasonable procedures to assure maximum possible accuracy of the information concerning the individual about whom the report relates and if a consumer disputes the accuracy of any information in the consumer’s file, to conduct a reasonable reinvestigation. CRAs are required to make available to consumers a free annual credit report. The FCRA imposes many other requirements on CRAs, data furnishers and users of consumer report information. Violation of the FCRA can result in civil and criminal penalties. The FCRA contains an attorney fee shifting provision to provide an incentive for consumers to bring individual or class action lawsuits against a CRA for violations of the FCRA. Regulatory enforcement of the FCRA is under the purview of the United States Federal Trade Commission (“FTC”), the Consumer Financial Protection Bureau (“CFPB”), and state attorneys general, acting alone or in concert with one another. |
| |
• | The Dodd-Frank Act - One of the purposes of the Dodd-Frank Wall Street Reform and Consumer Protection Act (“Dodd-Frank Act”) is to protect consumers from abusive financial services practices. Title X of the Dodd-Frank Act created the CFPB. The Dodd-Frank Act provides the CFPB with examination and supervisory authority over CRAs, including us. The Dodd-Frank Act also prohibits unfair, deceptive or abusive acts or practices (“UDAAP”) with respect to consumer finance and provides the CFPB with authority to enforce those provisions. The CFPB may pursue administrative proceedings or litigation to enforce the laws and rules subject to its jurisdiction. In these proceedings the CFPB can obtain cease and desist orders, which can include orders for restitution to consumers or rescission of contracts, as well as other types of affirmative relief, and monetary penalties ranging from $5,000 per day for ordinary violations and up to $1 million per day for knowing violations. Also, the Dodd-Frank Act empowers state attorneys general and state regulators to bring civil actions in certain circumstances for the kind of cease and desist orders available to the CFPB (but not for civil penalties). |
| |
• | FTC Act - The Federal Trade Commission Act (“FTC Act”) prohibits unfair methods of competition and unfair or deceptive acts or practices. Under the FTC Act, the Federal Trade Commission's oversight includes the security measures we employ to safeguard the personal data of consumers and failure to safeguard data adequately may subject us to regulatory scrutiny or enforcement action. There is no private right of action under the FTC Act. |
| |
• | GLBA - The Financial Services Modernization Act of 1999, or Gramm-Leach-Bliley Act (“GLBA”) regulates, among other things, the use of non-public personal information of consumers that is held by financial institutions, including us. We are subject to various GLBA provisions, including rules relating to the use or disclosure of the underlying data and rules relating to the physical, administrative and technological protection of non-public personal financial information. Breach of the GLBA can result in civil and/or criminal liability and sanctions by regulatory authorities. Regulatory enforcement of the GLBA is under the purview of the FTC, the CFPB, the federal prudential banking regulators, the SEC and state attorneys general, acting alone or in concert with each other. |
| |
• | CROA - The Credit Repair Organizations Act (“CROA”) regulates companies that claim to be able to assist consumers in improving their credit standing. There have been efforts to apply the CROA to credit monitoring services offered by consumer reporting agencies and others. CROA allows for a private right of action. Consumers can sue to recover the greater of the amount paid or actual damages, punitive damages, costs, and attorney’s fees for violations of CROA. |
State Laws and Regulation Relating to Consumer and Data Protection
| |
• | A number of states have enacted requirements similar to the federal FCRA. Some of these state laws impose additional, or more stringent, requirements than the FCRA, especially in connection with the investigations and responses to reported inaccuracies in consumer reports. The FCRA preempts some of these state laws, but the scope of preemption continues to be defined by the courts. The state of Vermont is grandfathered under the original FCRA requirements and thus we are subject to additional requirements to comply with Vermont law. |
| |
• | Most states and the District of Columbia have passed laws that give consumers the right to place a security freeze on their credit reports to prevent others from opening new accounts or obtaining new credit in their name. These laws place differing requirements on credit reporting agencies with respect to how and when to respond to such credit file freeze requests and in the fees, if any, the agencies may charge for freeze-related actions. |
| |
• | A majority of states have adopted versions of data security breach laws that require notification of affected consumers and potentially regulators in the event of a breach of personal information. A subset of these laws and other state data security laws require data protection measures as well. |
| |
• | We are also subject to federal and state laws that are generally applicable to any U.S. business with national or international operations, such as antitrust laws, the Foreign Corrupt Practices Act, the Americans with Disabilities Act, state unfair or deceptive practices acts and various employment laws. We continuously monitor legislative and regulatory activities that involve credit reporting, data privacy, security and other relevant issues to identify issues in order to remain in compliance with all applicable laws and regulations. |
Summary of International Regulation Relating to Consumer and Data Protection
We are subject to various data protection, privacy and consumer credit laws and regulations in the foreign countries where we operate. Examples of the most significant of these laws include, but are not limited to, the following:
| |
• | In the U.K., we are subject to a regulatory framework which provides for primary regulation by the Financial Conduct Authority (the “FCA”). The FCA focuses on consumer protection and market regulation as well as prudential supervision of regulated financial institutions. The FCA has significant powers, including the power to regulate conduct related to the marketing of financial products, to specify minimum standards and to place requirements on products, impose unlimited fines, and to investigate organizations and individuals. In addition, the FCA is able to ban financial products for up to a year while considering an indefinite ban; it has the power to instruct firms to immediately retract or modify promotions which it finds to be misleading, and to publish such decisions. Our core credit reporting (“credit reference”) and debt collections services and recovery management businesses in the U.K. are subject to FCA supervision and we are required to have certain corporate and “approved person” authorizations from the FCA to carry on such businesses. The license application for our collection business (TDX Group or "TDX") was approved in 2016, and the license application for authorization in our capacity as a credit reference agency was approved in 2017. In addition to regulation by the FCA, we are also subject to regulation covering personal data and protection by the U.K. Information Commissioner’s Office. In the U.K., regulatory limitations affect our use of the Electoral Roll, one of our key data sources in that jurisdiction. Generally, the data underlying the products offered by our U.K. Information Services and Global Consumer Solutions product lines, excluding our Commercial Services products, are subject to these regulations. |
| |
• | In Europe, we are subject to the European Union (“EU”) Data Protection Regulation ("GDPR"), which will replace the comprehensive 1995 European Union Data Protection Directive. The GDPR maintains the prohibition on the transfer of personal information from the EU to other countries whose laws do not protect personal data to an “adequate” level of privacy or security. The GDPR establishes multiple new requirements that are generally stricter and more comprehensive than those of the U.S. and most other countries where Equifax operates. In Spain and Portugal, privacy laws also regulate all credit bureau and personal solutions activities. The GDPR, among other things, will tighten data protection requirements and make enforcement more rigorous, for example, by streamlining enforcement at a European level, introducing data breach notification requirements and substantially increasing penalties for non-compliance. |
| |
• | In Canada, federal and provincial laws govern how we collect, use or disclose personal information in the course of our commercial activities. Federally, the Personal Information Protection and Electronic Documents Act governs the collection, use and disclosure of personal information by organizations in the private sector. It sets out specific obligations with respect to accountability and identifying purposes, consent, collection, use, disclosure, retention, accuracy, safeguards, individual access and compliance. The federal and provincial privacy regulators have powers of investigation and intervention, and provisions of Canadian law regarding civil liability apply in the event of unlawful processing which is prejudicial to the persons concerned. Canada also has specific credit reporting legislation that is regulated at a provincial level. At present, each province has credit reporting legislation, with the exception of New Brunswick and the Territories (Northwest Territories, Yukon, and Nunavut). Generally speaking, the legislation regulates the contents of credit files, the length of time information can be included on a credit file and who can receive credit reports. |
| |
• | In Latin America, data protection and credit reporting laws and regulations vary considerably among Latin American countries. Some countries, such as El Salvador, Ecuador and Honduras, establish a constitutional right to privacy without general data protection standards or a data protection authority. These countries, however, have laws that govern the functioning of credit bureaus. In 2017, Ecuador passed a law relating to the collection of credit data and the operation of a credit bureau within the country, which, if implemented, would effectively prohibit us from operating as a credit bureau within Ecuador. The Ecuadorian Superintendent of Banks (ESB) is obligated to set up a public credit data registry within 270 days of January 1, 2018. The ESB may offer services through third parties via a bid process, which may allow continued operation by us within Ecuador, but this is not certain. Other countries, such as Argentina, Uruguay, Peru and Costa Rica, have enacted comprehensive data protection legislation similar to the EU GDPR. The EU recognizes Argentina and Uruguay as having adequate levels of protection for personal data transfers and processing. Peru also has a specific law for credit reporting. Paraguay and Chile have fewer comprehensive data protection laws in place, but do have rules regarding reporting periods, consent and data collection. |
| |
• | In Australia, we are subject to regulatory oversight by various agencies. The Office of the Australian Information Commissioner (OAIC) is the agency with direct responsibility for administering the Australian Privacy Principles (which relate to the collection, holding, use and disclosure of personal information) and Part IIIA of the Privacy Act 1988 (which regulates credit reporting). The OAIC can investigate a complaint, conduct its own investigations, resolve/make binding determinations and seek civil penalties. Our credit reporting business, Equifax Information Services and Solutions, is a member of an external dispute resolution scheme, the Credit and Investments Ombudsman, which has been approved by the OAIC to handle privacy and credit reporting complaints and make binding determinations. The OAIC can register codes of practice under the Privacy Act 1988, and has registered the Privacy (Credit Reporting) Code 2014. The Australian Competition and Consumer Commission (ACCC) is the agency responsible for enforcing the Competition and Consumer Act 2010 and related legislation concerning consumer protection and competition. The ACCC has the authority to use a range of actions to ensure compliance with the law, including investigative powers and the ability to seek penalties through litigation and other formal enforcement means. The Australian Retail Credit Association (ARCA) is a credit and credit reporting industry self-regulatory body, which administers principles and standards for the exchange of credit data between industry participants. Equifax Australasia Credit Ratings Pty Limited (Formerly named Corporate Scorecard Pty Limited, one of our Australian subsidiaries), holds an Australia Financial Services License (AFSL), which allows it to provide general advice to wholesale clients by issuing a credit rating, and has been approved by the Reserve Bank of New Zealand as a rating agency under section 86 of the Non-bank Deposit Takers Act 2013. The Australian Securities and Investments Commission (ASIC) regulates that business, and has authority to investigate, prosecute, ban individuals, and to seek civil penalties. In addition, in Australia, draft legislation has been released by the Federal Government, mandating the supply by large banks of comprehensive credit information to credit reporting bodies, including Equifax, and imposing certain disclosure, storage and reporting obligations on the credit reporting bodies. The draft legislation is yet to be finalized or enacted. Equifax will continue to engage with the Federal Government as it concludes its consultation process. |
| |
• | In New Zealand, the regulatory framework provides for primary regulation under the Office of the Privacy Commissioner (OPC). The OPC investigates complaints relating to the collection, use, holding and disclosure of personal information, both credit-related and non-credit related. The OPC can make a finding that there has been an interference with privacy but cannot impose civil penalties. In extreme cases where there has been an interference with privacy it can refer these cases to the Director of Human Rights, for determination in the Human Rights Review Tribunal. The OPC can issue practice codes under the Privacy Act 1993, and has issued and subsequently amended, the Credit Reporting Privacy Code 2004. A self-regulatory body, the Retail Credit Association of New Zealand (RCANZ) addresses reciprocity of data issues relating to comprehensive credit reporting, and data standards. |
| |
• | In India, various legislation including the Information Technology Act 2000 and Rules framed thereunder and the Credit Information Companies (Regulation) Act of 2005 and Rules and Regulations framed thereunder, establishes a federal data protection framework. Entities that collect and maintain personal data and/or credit information must ensure that it is complete, accurate and safeguarded, and must adopt certain privacy principles with respect to collecting, processing, preserving, sharing and using such data and/or credit information. The Indian parliament has passed legislation that would allow individuals to sue for damages in the case of a data breach, if the entity negligently failed to implement reasonable security practices and procedures to protect personal data and/or credit information. Our Indian joint venture is subject to regulation by the Reserve Bank of India, which is India’s central banking institution. |
| |
• | In Russia, credit reporting activities are governed by the Federal Law on Credit Histories No.218-fz, dated December 30, 2004. The law regulates the contents of credit files, who may submit data to a credit bureau and who can receive credit reports. Russia has also enacted a comprehensive data protection law that is similar to Europe's approach. |
Tax Management Services
The Tax Management Services business within our Workforce Solutions segment is potentially impacted by changes in renewal or non-renewal of U.S. tax laws or interpretations, for example, those pertaining to work opportunity tax credits and unemployment compensation claims.
PERSONNEL
Equifax employed approximately 10,300 employees in 24 countries as of December 31, 2017. None of our U.S. employees are subject to a collective bargaining agreement and no work stoppages have been experienced. Pursuant to local laws, certain of our employees in Argentina and Spain are covered under government-mandated collective bargaining regulations that govern general salary and compensation matters, basic benefits and hours of work. In some of our non-U.S. subsidiaries, certain of our employees are represented by workers’ councils or statutory labor unions.
FORWARD-LOOKING STATEMENTS
This report contains information that may constitute “forward-looking statements.” Generally, the words “believe,” “expect,” “intend,” “estimate,” “anticipate,” “project,” “will” and similar expressions identify forward-looking statements, which generally are not historical in nature. All statements that address operating performance, events or developments that we expect or anticipate will occur in the future, including statements relating to future operating results and statements related to the cybersecurity incident reported in the third quarter of 2017 and the Tax Cuts and Jobs Act of 2017, are forward-looking statements. Management believes that these forward-looking statements are reasonable as and when made. However, forward-looking statements are subject to certain risks and uncertainties that could cause actual results to differ materially from our Company’s historical experience and our present expectations or projections, including without limitation our expectations regarding the Company’s outlook, long-term organic and inorganic growth, and customer acceptance of our business solutions referenced above under "Business” and below in Item 7. Management's Discussion and Analysis of Financial Condition and Results of Operation — “Business Environment and Company Outlook.” These risks and uncertainties include, but are not limited to, those described below in Item 1A. Risk Factors, and elsewhere in this report and those described from time to time in our future reports filed with the United States Securities and Exchange Commission, or SEC. As a result of such risks and uncertainties, we urge you not to place undue reliance on any such forward-looking statements. Forward-looking statements speak only as of the date when made. We undertake no obligation to publicly update or revise any forward-looking statements, whether as a result of new information, future events or otherwise, except as required by law.
AVAILABLE INFORMATION
Detailed information about us is contained in our annual reports on Form 10-K, quarterly reports on Form 10-Q, current reports on Form 8-K, proxy statements and other reports, and amendments to those reports, that we file with, or furnish to, the SEC. These reports are available free of charge at our website, www.equifax.com, as soon as reasonably practicable after we electronically file such reports with or furnish such reports to the SEC. However, our website and any contents thereof should not be considered to be incorporated by reference into this document. We will furnish copies of such reports free of charge upon written request to Equifax Inc., Attn: Office of Corporate Secretary, P.O. Box 4081, Atlanta, Georgia, 30302.
ITEM 1A. RISK FACTORS
All of the risks and uncertainties described below and the other information included in this Form 10-K should be considered and read carefully. The risks described below are not the only ones facing us. The occurrence of any of the following risks or additional risks and uncertainties not presently known to us or that we currently believe to be immaterial could materially and adversely affect our business, financial condition or results of operations. This Form 10-K also contains forward-looking statements and estimates that involve risks and uncertainties. Our actual results could differ materially from those anticipated in the forward-looking statements as a result of specific factors, including the risks and uncertainties described below.
Security breaches like the cybersecurity incident announced in September 2017 and other disruptions to our information technology infrastructure could compromise Company, consumer and customer information, interfere with our operations, cause us to incur significant costs for remediation and enhancement of our IT systems and expose us to legal liability, all of which could have a substantial negative impact on our business and reputation.
In the ordinary course of business, we collect, process, transmit and store sensitive data, including intellectual property, proprietary business information and personally identifiable information of consumers. The secure operation of our information technology networks and systems, and of the processing and maintenance of this information, is critical to our business operations and strategy. Despite our substantial investment in physical and technological security measures, employee training and contractual precautions, our information technology networks and infrastructure (or those of our third-party vendors and other service providers) are vulnerable to unauthorized access to data or breaches of confidential information due to criminal conduct, attacks by hackers, employee or insider malfeasance and/or human error.
In 2017, we were the target of a cybersecurity attack that involved the theft of certain personally identifiable information of U.S., Canadian and U.K. consumers. As a result of an ongoing analysis of data stolen in the 2017 cybersecurity incident, the Company recently announced that it was able to identify approximately 2.4 million U.S. consumers whose name and partial driver's license information were stolen, but who were not in the affected population of approximately 145.5 million consumers previously identified by the Company in 2017. The Company is in the process of notifying these additional consumers. It is possible that further analysis will identify additional consumers affected or additional types of data accessed, which could result in additional notifications and negative publicity.
Following the cybersecurity incident, we began undertaking significant remediation efforts and other steps to enhance our data security infrastructure. In connection with these efforts, we have incurred significant costs and expect to incur additional significant costs as we take further steps to prevent unauthorized access to our systems and the data we maintain. The actions we have taken are based on our investigation of the causes of the cybersecurity incident, but there will be additional changes needed to prevent a similar incident. We cannot assure that all potential causes of the incident have been identified and remediated and will not occur again.
Because our products and services involve the storage and transmission of personal information of consumers, we will continue to routinely be the target of attempted cyber and other security threats by outside third parties, including technically sophisticated and well-resourced bad actors attempting to access or steal the data we store. Insider or employee cyber and security threats are also a significant concern for all companies, including ours. In addition, the 2017 cybersecurity incident may embolden individuals or groups to target our systems. We must continuously monitor and develop our information technology networks and infrastructure to prevent, detect, address and mitigate the risk of unauthorized access, misuse, computer viruses and other events that could have a security impact. If we experience additional breaches of our security measures, including from incidents that we fail to detect for a period of time, sensitive data may be accessed, stolen, disclosed or lost. Any such access, disclosure or other loss of information could subject us to significant additional litigation, regulatory fines, penalties, losses of customers or reputational damage, any of which could have a significant negative impact on our cash flows, competitive position, financial condition or results of operations. We expect our insurance coverage will not be adequate to compensate us for all losses that may occur due to the 2017 cybersecurity incident and we cannot ensure that our insurance policies in the future will be adequate to cover losses from any future failures. In addition, our third-party insurance coverage will vary from time to time in both type and amount depending on availability, cost and our decisions with respect to risk retention.
The government investigations and litigation resulting from the 2017 cybersecurity incident will continue to adversely impact our business and results of operations.
As a result of the 2017 cybersecurity incident, we are currently a party to a consolidated multi-district consumer class action lawsuit and a consolidated multi-district financial institution class action lawsuit, as well as securities class action lawsuits, shareholder derivative litigation and other lawsuits and claims allegedly arising out of the cybersecurity incident seeking monetary damages or other relief. A number of U.S. federal, state, local and foreign governmental officials and agencies, including Congressional committees, the FTC, the CFPB, the SEC, the U.S. Department of Justice and state attorneys general offices in the U.S., the FCA in the U.K. and the Office of the Privacy Commissioner in Canada, continue to investigate events related to the 2017 cybersecurity incident, including how it occurred, the consequences thereof and our response thereto. Additional lawsuits, investigations and reports related to the 2017 cybersecurity incident may be filed, commenced or issued. The claims and investigations have resulted in the incurrence of significant external and internal legal costs and expenses and reputational damage to our business and are expected to continue throughout 2018 and beyond. The resolution of these matters may result in damages, costs, fines or penalties substantially in excess of our insurance coverage, which, depending on the amount, could have a material adverse effect on our liquidity or compliance with our credit agreements. If such damages, costs,
fines or penalties were great enough that we could not pay them through funds generated from operating activities and/or cause a default under our revolving credit facility, we may be forced to renegotiate or obtain a waiver under our revolving credit facility and/or seek additional debt or equity financing. Such renegotiation or financing may not be available on acceptable terms, or at all. In these circumstances, if we were unable to obtain sufficient financing, we may not be able to meet our obligations as they come due. The outcome of such claims and investigations could also adversely affect or cause us to change how we operate our business. The governmental agencies investigating the cybersecurity incident may seek to impose injunctive relief, consent decrees, or other civil or criminal penalties, which could, among other things, impact our ability to collect and use consumer information, materially increase our data security costs and/or otherwise require us to alter how we operate our business. Any legislative or regulatory changes adopted in reaction to the cybersecurity incident or other companies’ data breaches could require us to make modifications to the operation of our business that could have an adverse effect and/or increase or accelerate our compliance costs. Furthermore, these matters necessitate significant attention by management, which may divert the focus of management from the operation of our business resulting in an adverse impact on our results of operations.
The cybersecurity incident and the adverse publicity that followed have had a negative impact on our reputation, and we cannot assure it will not have a long-term effect on our relationships with our customers, our revenue and our business.
Our revenue growth in 2017 as compared to 2016 was negatively impacted by the cybersecurity incident. Certain of our customers have determined to defer or cancel new contracts or projects and others could consider such actions unless and until we can provide assurances regarding our ability to prevent unauthorized access to our systems and the data we maintain. Many of our customers are requiring security audits of our systems and any negative results of such audits may cause further losses of customers. In addition, some of our current and potential customers and the contracts governing certain customer relationships, as well as certain of our data suppliers, require us to maintain International Organization for Standardization (“ISO”) certifications, such as ISO 27001 certification, that specify requirements for establishing, implementing, operating, monitoring, reviewing, maintaining and improving a documented information security management system. Due to the 2017 cybersecurity incident, certain of our ISO certifications have been suspended and we will be required to take additional remediation steps to retain such certifications, which efforts may not be successful. Additionally, certain of our payment card industry certifications have been suspended which could result in fines and loss of access to data if we are not able to complete the necessary remediation steps to retain these certifications, which would adversely affect our ability to offer certain products to customers. If we are unable to demonstrate the security of our systems and the data we maintain and rebuild the trust of our customers, consumers and data suppliers, and if further negative publicity continues, we could experience a substantial negative impact on our business.
The loss of access to credit, employment, financial and other data from external sources could harm our ability to provide our products and services.
We rely extensively upon data from external sources to maintain our proprietary and non-proprietary databases, including data received from customers, strategic partners and various government and public record sources. This data includes the widespread and voluntary contribution of credit data from most lenders in the U.S and many other markets as well as the contribution of data under proprietary contractual agreements, such as employers’ contribution of employment and income data to The Work Number, financial institutions’ contribution of individual financial data to IXI, and telecommunications, cable and utility companies’ contribution of payment and fraud data to the National Cable, Telecommunications and Utility Exchange. For a variety of reasons, including concerns of data furnishers arising out of the 2017 cybersecurity incident, legislatively or judicially imposed restrictions on use, additional security breaches or competitive reasons, our data sources could withdraw, delay receipt of or increase the cost of their data provided to us. Where we currently have exclusive use of data, the providers of the data sources could elect to make the information available to competitors. We also compete with several of our third-party data suppliers. If a substantial number of data sources or certain key data sources were to withdraw or be unable to provide their data, if we were to lose access to data due to government regulation, if we lose exclusive right to the use of data, or if the collection, disclosure or use of data becomes uneconomical, our ability to provide products and services to our clients could have a significant negative impact, which could result in decreased revenue, net income and earnings per share and reputational loss. There can be no assurance that we would be able to obtain data from alternative sources if our current sources become unavailable.
Negative changes in general economic conditions, including interest rates, unemployment rates, income, home prices, investment values and consumer confidence, could adversely affect us.
Our customers, and therefore our business and revenues, are sensitive to negative changes in general economic conditions, including the demand and availability of affordable credit and capital, the level and volatility of interest rates, inflation, employment levels, consumer confidence and housing demand, both inside and outside the U.S. Business customers
use our credit information and related analytical services and data to process applications for new credit cards, automobile loans, home and equity loans and other consumer loans, and to manage their existing credit relationships. Demand for our services tends to be correlated to general levels of economic activity and to consumer credit activity. Bank and other lenders’ willingness to extend credit is adversely affected by elevated consumer delinquency and loan losses in a weak economy. Consumer demand for credit (i.e., rates of spending and levels of indebtedness) also tends to grow more slowly or decline during periods of economic contraction or slow economic growth.
Our customer base suffers when financial markets experience volatility, illiquidity and disruption, which has occurred in the past and which could reoccur, and the potential for increased and continuing disruptions going forward presents considerable risks to our business and revenue. High or rising rates of unemployment and interest, declines in income, home prices or investment values, lower consumer confidence and reduced access to credit adversely affect demand for our products and services, and consequently our revenue and results of operations, as consumers may postpone or reduce their spending and use of credit, and lenders may reduce the amount of credit offered or available.
Our markets are highly competitive and new product introductions and pricing strategies being offered by our competitors could decrease our sales and market share or require us to enhance our products and services or reduce our prices in a manner that reduces our operating margins.
We operate in a number of geographic, product and service markets that are highly competitive. Competitors may develop products and services that are superior to or that achieve greater market acceptance than our products and services. The size of our competitors varies across market segments, as do the resources we have allocated to the segments we target. Therefore, some of our competitors may have significantly greater financial, technical, marketing or other resources than we do in one or more of our market segments, or overall. As a result, our competitors may be in a position to respond more quickly than we can to new or emerging technologies and changes in customer requirements, or may devote greater resources than we can to the development, enhancement, promotion, sale and support of products and services, or some of our customers may develop products of their own that replace the products they currently purchase from us, which would result in lower revenue. In addition, many of our competitors have extensive consumer relationships, including relationships with our current and potential customers. Moreover, new competitors or alliances among our competitors may emerge and potentially reduce our market share, revenue or margins.
We also sell our information to competing firms, and buy information from certain of our competitors, in order to sell “tri-bureau” and other products, most notably into the U.S. mortgage market. Changes in prices between competitors for this information and/or changes in the design or sale of tri-bureau versus single bureau product offerings may affect our revenue or profitability.
Some of our competitors may choose to sell products that compete with ours at lower prices by accepting lower margins and profitability, or may be able to sell products competitive to ours at lower prices, individually or as a part of integrated suites, given proprietary ownership of data, technological superiority or economies of scale. Price reductions by our competitors could negatively impact our margins and results of operations and could also harm our ability to obtain new customers on favorable terms. Historically, certain of our key products have experienced declines in per unit pricing due to competitive factors and customer demand. Since a significant portion of our operating expenses is relatively fixed in nature due to sales, information technology and development and other costs, if we were unable to respond quickly enough to changes in competition or customer demand, we could experience further reductions in our operating margins.
Our relationships with key long-term customers may be materially diminished or terminated
We have long-standing relationships with a number of our customers, many of whom could unilaterally terminate their relationship with us or materially reduce the amount of business they conduct with us at any time. Many of our material customer agreements can be terminated by the customer for convenience on advance written notice, which provides our customers with the opportunity to renegotiate their contracts with us or to award more business to our competitors.
We also provide our services to business partners who may combine them with their own or other branded services to be offered as a bundle to consumers, governmental agencies and businesses in support of fraud or credit protection, credit monitoring, identity authentication, insurance or credit underwriting, and collections. Some of these partners are the largest providers of credit information or identity protection services to the consumer market.
Market competition, business requirements, financial condition and consolidation through mergers or acquisitions, could adversely affect our ability to continue or expand our relationships with our customers and business partners. There is no guarantee that we will be able to retain or renew existing agreements, maintain relationships with any of our customers or
business partners on acceptable terms or at all, or collect amounts owed to us from insolvent customers or business partners. The loss of one or more of our major customers or business partners could adversely affect our business, financial condition and results of operations.
If we do not introduce successful new products, services and analytical capabilities in a timely manner, or if the market does not adopt our new services, our competitiveness and operating results will suffer.
We generally sell our products in industries that are characterized by rapid technological changes, frequent new product and service introductions and changing industry standards. In addition, certain of the markets in which we operate are seasonal and cyclical. Without the timely introduction of new products, services and enhancements, our products and services will become technologically or commercially obsolete over time, in which case our revenue and operating results would suffer. The success of our new products and services will depend on several factors, including our ability to properly identify customer needs; innovate and develop new technologies, services and applications; successfully commercialize new technologies in a timely manner; produce and deliver our products in sufficient volumes on time; differentiate our offerings from competitor offerings; price our products competitively; anticipate our competitors’ development of new products, services or technological innovations; and control product quality in our product development process. Our resources have to be committed to any new products and services before knowing whether the market will adopt the new offerings. In addition, our management is and will continue to be intensely focused on enhancing our security measures and responding to consumer and customer concerns relating to the 2017 cybersecurity incident and may not be able to devote sufficient time to new product development, which could cause us to be less competitive as compared to our peers, lose out on new revenue opportunities and have an adverse effect on our growth and our business.
The demand for some of our products and services may be negatively impacted to the extent the availability of free or less expensive consumer information increases.
Public or commercial sources of free or relatively inexpensive consumer credit, credit score and other information have become increasingly available, particularly through the internet, and this trend is expected to continue. In addition, governmental agencies in particular have increased the amount of information to which they provide free public access and these or other sources of free or relatively inexpensive consumer information from competitors or other commercial sources may reduce demand for our services, particularly in our USIS and Global Consumer Solutions business units. Recently, there also has been an increase in companies offering free or low-cost direct to consumer credit services (such as credit scores, reports and monitoring) as part of alternative business models that use such services as a means to introduce consumers to other products and services. To the extent that our customers choose not to obtain services from us and instead rely on information obtained at no cost or relatively inexpensively from these other sources, our business, financial condition and results of operations may be adversely affected.
Due to the 2017 cybersecurity incident and our provision of free services to consumers in connection therewith, we ceased the advertisement and sale of new products in our direct to consumer business, which resulted in a significant decline in revenue in that business. Furthermore, in late January 2018, we began offering a new credit lock service, Lock & AlertTM, that is free for life and is aimed at empowering consumers to control access to their Equifax credit file directly and quickly from their smartphone or computer. We expect services like our Lock & AlertTM to continue to increase, thereby eliminating the market for many consumer direct products and services. As a result of these factors, we expect that revenue from our direct to consumer business will continue to decline. Additionally, if a significant number of consumers lock or freeze their file, our population of data is reduced which could affect our product offerings and value to our customers in our other businesses.
If we experience system constraints or failures, or our customers do not modify and/or upgrade their systems to accept new releases of our products and services, our services to our customers could be delayed or interrupted, which could result in lost revenues or customers, lower margins, or other harm to our business and reputation.
We depend on reliable, stable, efficient and uninterrupted operation of our technology network, systems, and data centers to provide service to our customers. Many of the services and systems upon which we rely have been outsourced to third parties. In addition, many of our revenue streams are dependent on links to third party telecommunications providers. These systems and operations, and the personnel that support, service and operate these systems, could be exposed to interruption, damage or destruction from power loss, telecommunication failures, computer viruses, denial-of-service attacks, employee or insider malfeasance, human error, fire, natural disasters, war, terrorist acts or civil unrest. We may not have sufficient disaster recovery or redundant operations in place to cover a loss or failure of systems or telecommunications links in a timely manner. In addition, we will continue to be intensely focused on enhancing our data security infrastructure and implementation of those enhancements could result in service interruptions. Any significant delay or interruption could result in lost revenues or customers, lower margins, or other significant harm to our business or reputation.
We and our customers are subject to various current laws and governmental regulations, and could be affected by new laws or regulations, including as a result of the 2017 cybersecurity incident, compliance with which may cause us to incur significant expenses and change our business practices, and if we fail to maintain satisfactory compliance with certain regulations, we could be subject to civil or criminal penalties.
We are subject to a number of U.S. federal, state, local and foreign laws and regulations relating to consumer privacy, data and financial protection. See Item 1. Business - "Governmental Regulation" in this Form 10-K for a summary of the U.S. and foreign consumer and data protection laws and regulations to which we are subject. These regulations are complex, change frequently, have tended to become more stringent over time, and are subject to administrative interpretation and judicial construction in ways that could harm our business. Furthermore, we expect there to be an increased focus on laws and regulations related to our business because of the great public concern in the U.S. with regard to the operation of credit reporting agencies, as well as the collection, use, accuracy, correction and sharing of personal information, which was heightened by the 2017 cybersecurity incident. For example, there are a number of legislative proposals pending before the U.S. Congress, various state legislative bodies and foreign governments concerning data protection due to our 2017 cybersecurity incident and other high-profile breaches that could affect us and the President of the United States could act by Executive Order. In addition, a growing number of legislative and regulatory bodies have adopted consumer notification and other requirements in the event that consumer information is accessed by unauthorized persons and additional regulations regarding the use, access, accuracy and security of such data are possible. In the U.S., state laws provide for disparate notification regimes, all of which we are subject to. Further, any perception that our practices or products are an invasion of privacy, whether or not consistent with current or future regulations and industry practices, may subject us to public criticism, private class actions, reputational harm, or claims by regulators, which could disrupt our business and expose us to increased liability.
We devote substantial compliance, legal and operational business resources to facilitate compliance with applicable regulations and requirements. In the future, we may be subject to significant additional expense to ensure continued compliance with applicable laws and regulations and to investigate, defend or remedy actual or alleged violations. Additionally, we cooperate with CFPB supervisory examinations and respond to other state, federal and foreign government investigations of our business practices. Any failure by us to comply with, or remedy any violations of, applicable laws and regulations could result in the curtailment of certain of our operations, the imposition of fines and penalties, liability to private plaintiffs as a result of individual or class action litigation, restrictions on our ability to carry on or expand our operations, and reputational harm. In addition, because many of our products are regulated or sold to customers in various industries, we must comply with additional regulations in marketing our products. Moreover, our compliance with privacy laws and regulations and our reputation depend in part on customers' adherence to privacy laws and regulations and their use of our services in ways consistent with consumer expectations and regulatory requirements. We cannot predict the ultimate impact on our business of new or proposed CFPB, FCA or other rules, supervisory examinations or government investigations or enforcement actions.
The following legal and regulatory developments also could have a substantial negative impact on our business, financial condition or results of operations:
| |
• | amendment, enactment or interpretation of laws and regulations that restrict the access and use of personal information and reduce the availability or effectiveness of our solutions or the supply of data available to customers; |
| |
• | changes in cultural and consumer attitudes in favor of further restrictions on information collection and sharing, which may lead to regulations that prevent full utilization of our solutions; |
| |
• | failure of data suppliers or customers to comply with laws or regulations, where mutual compliance is required; |
| |
• | failure of our solutions to comply with current laws and regulations; and |
| |
• | failure of our solutions to adapt to changes in the regulatory environment in an efficient, cost effective manner. |
For example, Ecuador passed a law in December 2017 that, if implemented, would effectively prohibit us from operating as a credit bureau within Ecuador unless we are selected to operate under contract to serve the public authority that the new law tasks with providing such services. These laws and regulations (as well as actions that may be taken by legislatures and regulatory bodies in other countries) and the consequences of any violation could limit our ability to pursue business opportunities we might otherwise consider engaging in, impose additional costs on us, result in significant loss of revenue, result in significant restitution and fines, impact the value of assets we hold, or otherwise adversely affect our business. See “Item 1. Business - Governmental Regulation” and “Item 3. Legal Proceedings” in this Form 10-K.
Regulatory oversight of our contractual relationships with certain of our customers may adversely affect our business.
The federal banking agencies, including the Office of the Comptroller of the Currency, the Federal Deposit Insurance Corporation, the Board of Governors of the Federal Reserve System and the CFPB, as well as many state banking agencies
have issued guidance to insured depository institutions and other providers of financial services on assessing and managing risks associated with third-party relationships, which include all business arrangements between a financial services provider and another entity, by contract or otherwise, and generally requires banks and financial services providers to exercise comprehensive oversight throughout each phase of a bank or financial service provider’s business arrangement with third-party service providers, and instructs banks and financial service providers to adopt risk management processes commensurate with the level of risk and complexity of their third-party relationships. This guidance requires more rigorous oversight of third-party relationships that involve certain “critical activities.” In light of this guidance, our existing or potential bank and financial services customers subject to this guidance may continue to revise their third-party risk management policies and processes and the terms on which they do business with us, which may adversely affect our relationship with such customers. In response to the 2017 cybersecurity incident, we also have been contacted by state banking regulators seeking to examine our practices as a third-party service provider to the entities that they regulate. It is possible that these or similar examinations by federal or state banking regulators could lead to adverse changes in our customer relationships.
Economic, political and other risks associated with international sales and operations could adversely affect our results of operations.
Sales outside the U.S. comprised 29% of our operating revenue in 2017. As a result, our business is subject to various risks associated with doing business internationally. In addition, many of our employees, suppliers, job functions and facilities are located outside the U.S. Accordingly, our future results could be harmed by a variety of factors including:
| |
• | changes in specific country or region political, economic or other conditions; |
| |
• | trade protection measures; |
| |
• | data privacy and consumer protection regulations; |
| |
• | difficulty in staffing and managing widespread operations; |
| |
• | differing labor, intellectual property protection and technology standards and regulations; |
| |
• | business licensing requirements or other requirements relating to making foreign direct investments, which could increase our cost of doing business in certain jurisdictions, prevent us from entering certain markets, increase our operating costs or lead to penalties or restrictions; |
| |
• | difficulties associated with repatriating cash generated or held abroad in a tax-efficient manner; |
| |
• | implementation of exchange controls; |
| |
• | geopolitical instability, including terrorism and war; |
| |
• | foreign currency changes; |
| |
• | increased travel, infrastructure, legal and compliance costs of multiple international locations; |
| |
• | foreign laws and regulatory requirements; |
| |
• | terrorist activity, natural disasters and other catastrophic events; |
| |
• | restrictions on the import and export of technologies; |
| |
• | difficulties in enforcing contracts and collecting accounts receivable; |
| |
• | failure to meet quality standards for outsourced work; |
| |
• | the presence and acceptance of varying level of business corruption in international markets; and |
| |
• | varying business practices in foreign countries |
We earn revenue, pay expenses, own assets and incur liabilities in countries using currencies other than the U.S. dollar, including among others the British pound, the Australian dollar, the Canadian dollar, the Argentine peso, the Chilean peso, the Euro, the New Zealand dollar, the Costa Rican colon, the Singapore dollar, the Brazilian real, the Russian ruble and the Indian rupee. Because our consolidated financial statements are presented in U.S. dollars, we must translate revenue, income and expenses, as well as assets and liabilities, into U.S. dollars at exchange rates in effect during or at the end of each reporting period. Therefore, increases or decreases in the value of the U.S. dollar against major currencies will affect our operating revenues, operating income and the value of balance sheet items denominated in foreign currencies. In 2017, a general weakening of foreign currencies in countries where we have operations against the U.S. dollar had a negative impact on our results as reported in U.S. dollars. See “Segment Financial Results - International - Asia Pacific,” “ - Europe,” “ -Latin America,” and “- Canada” and “Effects of Inflation and Changes in Foreign Currency Exchange Rates” in the Management’s Discussion and Analysis section of this Form 10-K. Because of the geographic diversity of our operations, weaknesses in some currencies might be offset by strengths in others over time. We generally do not mitigate the risks associated with fluctuating exchange rates, although we may from time to time through forward contracts or other derivative instruments hedge a portion of our translational foreign currency exposure or exchange rate risks associated with material transactions which are denominated in a foreign currency. The use of such hedging activities may not offset any or more than a portion of the adverse financial effects of unfavorable movements in foreign exchange rates over the limited time the hedges are in place.
Accordingly, fluctuations in foreign currency exchange rates, particularly the strengthening of the U.S. dollar against major currencies, may materially affect our consolidated financial results.
We also have a cost method investment in a credit information company in Brazil valued in Brazilian reais. Economic and competition risks within Brazil, and the company’s ability to successfully implement its strategic and operating plans, have had an adverse financial impact on the value of our investment and could result in an additional impairment of the investment.
Compliance with applicable U.S. and foreign laws and regulations, such as anti-corruption laws, tax laws, foreign exchange controls and restrictions on repatriation of earnings or other similar restraints, data privacy requirements, labor laws and anti-competition relations increases the cost of doing business in foreign jurisdictions. Although we have implemented policies and procedures to comply with these laws and regulations, a violation by our employees, contractors or agents could nevertheless occur.
We are regularly involved in claims, suits, government investigations, supervisory examinations and other proceedings that may result in adverse outcomes.
In addition to what we are currently experiencing due to the 2017 cybersecurity incident, we are regularly involved in claims, suits, government investigations, supervisory examinations and regulatory proceedings arising from the ordinary course of our business, including actions with respect to consumer protection and data protection, including purported class action lawsuits. Such claims, suits, government investigations and proceedings are inherently uncertain and their results cannot be predicted with certainty. Regardless of their outcome, such legal proceedings can have an adverse impact on us because of legal costs, diversion of management and other personnel, and other factors. In addition, it is possible that a resolution of one or more such proceedings could result in reputational harm, liability, penalties, or sanctions, as well as judgments, consent decrees, or orders preventing us from offering certain features, functionalities, products, or services, or requiring a change in our business practices, products or technologies, which could in the future materially and adversely affect our business, operating results, and financial condition. The FCRA contains an attorney fee shifting provision to provide an incentive for consumers to bring individual and class action lawsuits against a CRA for violation of the FCRA, and the number of consumer lawsuits (both individual and class action) against us alleging a violation of FCRA and our resulting costs associated with resolving these lawsuits have increased substantially over the past several years.
We rely, in part, on acquisitions, joint ventures and other alliances to grow our business and expand our geographic reach. The acquisition, integration or divestiture of businesses by us may not produce the expected financial, operating results or IT and data security profile we expect. In addition, if we are unable to make acquisitions or successfully develop and maintain joint ventures and other alliances, our growth may be adversely impacted.
Historically, we have relied, in part, on acquisitions, joint ventures and other alliances to grow our business. Over the past several years, we have acquired many smaller businesses in the U.S. and across the world. Furthermore, during 2016, we acquired Veda, the leading provider of credit information and analysis in Australia and New Zealand, for cash consideration plus debt assumed of approximately $1.9 billion. In January 2014, we acquired TDX, a debt placement service and debt management platform company in the United Kingdom for approximately $323 million. Acquisitions may not be completed on favorable terms, and the expected benefits, synergies and growth from these initiatives may not materialize as planned. We may have difficulty assimilating new businesses and their products, services, technologies, IT systems and personnel into our operations. IT and data security profiles of acquired companies may not meet the Equifax standard and may take longer to integrate and remediate than planned. This may result in significantly greater transaction costs for future acquisitions than we have experienced historically, or it could mean that we will not pursue certain acquisitions where the costs of integration and remediation are too significant. We may also have difficulty integrating and operating businesses in countries and geographies where we do not currently have a significant presence, and acquisitions of businesses having a significant presence outside of the U.S. will increase our exposure to risks of conducting operations in international markets. Similarly, any divestitures will be accompanied by risks commonly encountered in the sale of businesses. These difficulties could disrupt our ongoing business, distract our management and workforce, increase our expenses and adversely affect our operating results and financial condition.
Despite our past experience, opportunities to grow our business through acquisitions, joint ventures and other alliances may not be available to us in the future. In addition, as a result of the 2017 cybersecurity incident and the resources and management attention required in connection therewith, there may be more limited resources available for acquisitions and management’s attention is likely to be diverted away from sourcing and developing potential acquisition and joint venture opportunities, resulting in decreased growth.
Dependence on outsourcing certain portions of our operations may adversely affect our ability to bring products to market and damage our reputation. Dependence on outsourced information technology and other administrative functions may impair our ability to operate effectively.
As part of our efforts to streamline operations and to reduce operating costs, we have outsourced various components of our application development, information technology, operational support and administrative functions and will continue to evaluate additional outsourcing. Although we have implemented service level agreements and have established monitoring controls, if our outsourcing vendors fail to perform their obligations in a timely manner or at satisfactory quality levels including with respect to data and system security, or increase prices for their services to unreasonable levels, our ability to bring products to market and support our customers, and our reputation could suffer. Any failure to perform on the part of these third-party providers could impair our ability to operate effectively and could result in lower future revenue, unrealized efficiencies and adversely impact our results of operations and our financial condition. Much of our outsourcing takes place in developing countries and, as a result, may be subject to geopolitical uncertainty.
Changes in income tax laws can significantly impact our net income.
Federal and state governments in the U.S. as well as a number of other governments around the world are currently facing significant fiscal pressures and have considered or may consider changes to their tax laws for revenue raising or economic competitiveness reasons. Changes to tax laws can have immediate impacts, either favorable or unfavorable, on our results of operations and cash flows, and may impact our competitive position versus certain competitors who are domiciled in other jurisdictions and subject to different tax laws. In December 2017, the U.S. enacted the Tax Cuts and Jobs Act of 2017 which will significantly impact our U.S. and global tax expense. The application of many provisions in the Tax Cuts and Jobs Act of 2017 are uncertain at this time. The impact on Equifax will not be fully known until further guidance is provided by the U.S. Treasury.
If our government contracts are terminated, if we are suspended from government work, or if our ability to compete for new contracts is adversely affected, our business could suffer.
We derive a portion of our revenue from direct and indirect sales to U.S., state, local and foreign governments and their respective agencies. Such contracts are subject to various procurement laws and regulations, and contract provisions relating to their formation, administration and performance. Failure to comply with these laws, regulations or provisions in our government contracts could result in the imposition of various civil and criminal penalties, termination of contracts, forfeiture of profits, suspension of payments, or suspension of future government contracting. Following the 2017 cybersecurity incident, our government contracts received enhanced scrutiny and negative media attention that resulted in the suspension of one of our contracts. If we are unable to repair the reputational damage cause by the 2017 cybersecurity incident and ensure the security of the data we maintain, our ability to maintain our existing and acquire new government contracts may be substantially impacted.
Also, the government programs to which we provide services, or which are the basis of compliance services we provide non-governmental clients, including, in particular, the employer requirements under the Affordable Care Act, may be terminated or substantially altered by the government and our services would no longer be needed. If our government contracts are terminated, if we are suspended from government work, if the services we provide are no longer needed due to government program change or termination, or if our ability to compete for new contracts is adversely affected, our business could suffer.
Third parties may claim that we are infringing on their intellectual property and we could suffer significant litigation or licensing expenses or be prevented from selling products or services.
There has been substantial litigation in the U.S. regarding intellectual property rights in the information technology industry. From time to time, third parties may claim that one or more of our products or services infringe their intellectual property rights. We analyze and take action in response to such claims on a case by case basis. Any dispute or litigation regarding patents or other intellectual property could be costly and time-consuming due to the complexity of our technology and the uncertainty of intellectual property litigation, could divert our management and key personnel from our business operations and we may not prevail. A claim of intellectual property infringement could force us to enter into a costly or restrictive license agreement, which might not be available under acceptable terms or at all, or could subject us to significant damages or to an injunction against development and sale of certain of our products or services. Our intellectual property portfolio may not be useful in asserting a counterclaim, or negotiating a license, in response to a claim of intellectual property infringement. In certain of our businesses we rely on third-party intellectual property licenses and we cannot ensure that these licenses will be available to us in the future on favorable terms or at all. Although our policy is to obtain licenses or other rights where necessary, we cannot provide assurance that we have obtained all required licenses or rights.
Third parties may misappropriate or infringe on our intellectual property and we may suffer competitive injury or expend significant resources enforcing our rights.
Our success increasingly depends on our proprietary technology. We rely on various intellectual property rights, including patents, copyrights, database rights, trademarks and trade secrets, as well as contract restrictions, confidentiality provisions and licensing arrangements, to establish our proprietary rights. The extent to which such rights can be protected varies in different jurisdictions. If we do not enforce our intellectual property rights successfully our competitive position may suffer which could harm our operating results. Our pending patent and trademark applications may not be allowed or competitors may challenge the validity or scope of our intellectual property rights. In addition, our patents, copyrights, trademarks and other intellectual property rights may not provide us a significant competitive advantage.
We may need to devote significant resources, including cybersecurity resources, to monitoring our intellectual property rights and we may or may not be able to detect misappropriation or infringement by third parties. Our competitive position may be harmed if we cannot detect misappropriation or infringement and enforce our intellectual property rights quickly or at all. In some circumstances, enforcement may not be available to us because a third party has a dominant intellectual property position or for other business reasons. In addition, competitors might avoid infringement by designing around our intellectual property rights or by developing non-infringing competing technologies. Intellectual property rights and our ability to enforce them may be unavailable or limited in some countries which could make it easier for competitors to capture market share and could result in lost revenue.
The U.K’s impending departure from the EU could adversely affect us.
The referendum on the U.K.’s membership in the EU (referred to as “Brexit”) approving the exit of the U.K. from the EU could cause disruptions to and create uncertainty surrounding our business, including affecting our relationships with our existing and future customers, suppliers and employees, which could have an adverse effect on our business, financial results and operations. While the referendum was non-binding, the U.K. parliament has voted in favor of allowing the government to commence negotiations to determine the future terms of the U.K.’s relationship with the EU, including the terms of trade between the U.K. and the EU and other nations. The effects of Brexit will depend on any agreements the U.K. makes to retain access to EU markets either during a transitional period or more permanently. In addition, developments regarding Brexit may also create global economic uncertainty, which may cause our clients to closely monitor their costs and reduce their spending on our solutions and services.
A downgrade to our credit ratings would increase our cost of borrowing under our credit facility and adversely affect our ability to access the capital markets.
We are party to a $900.0 million unsecured, revolving credit facility that matures in November 2020 and an $800.0 million term loan facility that matures in November 2018 (collectively, the “Senior Credit Facilities”). The cost of borrowing under the Senior Credit Facilities and our ability and the terms under which we may access the credit markets are affected by credit ratings assigned to our indebtedness by the major credit rating agencies. These ratings are premised on our performance under assorted financial metrics, such as leverage and interest coverage ratios and other measures of financial strength, business and financial risk, industry conditions, transparency with rating agencies and timeliness of financial reporting. Our current ratings have served to lower our borrowing costs and facilitate access to a variety of lenders. However, there can be no assurance that our credit ratings or outlook will not be lowered in the future in response to adverse changes in these metrics caused by our operating results or by actions that we take that reduce our profitability or that require us to incur additional indebtedness for items such as substantial cash acquisitions, significant increases in costs and capital spending in security and IT systems, significant costs related to settlements of litigation or regulatory requirements, or by returning excess cash to shareholders through dividends or under our share repurchase program. A downgrade of our credit ratings would increase our cost of borrowing under the Senior Credit Facilities, negatively affect our ability to access the capital markets on advantageous terms, or at all, negatively affect the trading price of our securities and have a significant negative impact on our business, financial condition and results of operations.
We may not be able to borrow under our revolving credit facility and Receivables Facility.
We are party to a $225.0 million, 2-year receivables funding facility ("the "Receivables Facility") as well as the Senior Credit Facilities. Our revolving credit facility and Receivables Facility have representations, covenants, financial covenants and events of default which may limit our ability to borrow under such debt obligations. Any breach of a representation or failure to comply with any covenant or financial covenant or the occurrence of any event of default under the Senior Credit Facilities or the Receivables Facility could result in a prohibition of further borrowings under the revolving credit facility and Receivables
Facility or acceleration of any obligations outstanding thereunder. Any event of default under the Senior Credit Facilities or Receivables Facility could result in a cross default under our other outstanding debt obligations.
Changes in interest rates could adversely affect our cost of capital and net income.
Rising interest rates, credit market dislocations and decisions and actions by credit rating agencies can affect the availability and cost of our funding and adversely affect our net income.
Our business will suffer if we are not able to retain and hire key personnel.
Our future success depends partly on the continued service of our key development, sales, marketing, executive and administrative personnel. Additionally, increased retention risk exists in certain key areas of our operations, such as IT and security, which require specialized skills, such as maintenance of certain legacy computer systems, data security experts and analytical modelers. If we fail to retain and hire a sufficient number of these personnel, we will not be able to maintain or expand our business. Further, as a result of the cybersecurity incident we may suffer increased attrition. We believe our pay levels are competitive within the regions in which we operate. However, there is also intense competition for certain highly technical specialties in geographic areas where we continue to recruit, and it may become more difficult to retain our key employees.
Our retirement and post-retirement pension plans are subject to financial market risks that could adversely affect our future results of operations and cash flows.
We have significant retirement and post retirement pension plan assets and obligations. The performance of the financial markets and interest rates impact our plan expenses and funding obligations. Significant decreases in market interest rates, decreases in the fair value of plan assets and investment losses on plan assets will increase our funding obligations, and adversely impact our results of operations and cash flows.
We are subject to a variety of other general risks and uncertainties inherent in doing business.
In addition to the specific factors discussed above, we are subject to risks that are inherent to doing business. These include growth rates, general economic and political conditions, customer satisfaction with the quality of our services, costs of obtaining insurance, changes in unemployment rates, and other events that can impact revenue and the cost of doing business.
ITEM 1B. UNRESOLVED STAFF COMMENTS
None.
ITEM 2. PROPERTIES
Our executive offices are located at 1550 Peachtree Street, N.W., Atlanta, Georgia. Our other properties are geographically distributed to meet sales and operating requirements worldwide. We consider these properties to be both suitable and adequate to meet our current operating requirements. We ordinarily lease office space for conducting our business and are obligated under approximately 80 leases and other rental arrangements for our field locations. We owned 8 office buildings at December 31, 2017, including our executive offices, one campus which houses our Alpharetta, Georgia data center, a building utilized by our Workforce Solutions operations located in St. Louis, Missouri, as well as three buildings utilized by our Latin America operations located in Mexico City, Mexico and Asuncion, Paraguay. We also own 23.5 acres adjacent to the Alpharetta, Georgia data center.
For additional information regarding our obligations under leases, see Note 6 of the Notes to Consolidated Financial Statements in this report. We believe that suitable additional space will be available to accommodate our future needs.
ITEM 3. LEGAL PROCEEDINGS
Cybersecurity Incident Litigation, Claims and Government Investigations. Following the 2017 cybersecurity incident, hundreds of class actions were filed by consumers against us in federal, state and Canadian courts relating to the cybersecurity incident. The plaintiffs in these cases, who purport to represent various classes of consumers, generally claim to have been harmed by alleged actions and/or omissions by Equifax in connection with the cybersecurity incident and assert a variety of common law and statutory claims seeking monetary damages, injunctive relief and other related relief. In addition, certain class actions have been filed by financial institutions who allege their businesses have been placed at risk due to the cybersecurity incident and generally assert various common law claims such as claims for negligence and breach of contract, as well as, in some cases, statutory claims. The financial institutions class actions seek compensatory damages and other related relief. Furthermore, a lawsuit has been filed by the City of Chicago with respect to the cybersecurity incident alleging violations of state laws and local ordinances governing protection of personal data, consumer fraud and breach notice requirements and business practices. Beginning on December 6, 2017 and pursuant to multiple subsequent orders, the U.S. Judicial Panel on Multidistrict Litigation ordered the consolidation and transfer for pre-trial proceedings with respect to the U.S. cases pending in federal court discussed above to the Northern District of Georgia as the single U.S. District Court for centralized proceedings. Based on this order, consolidated pre-trial hearings with respect to U.S. consumer and financial institution federal class actions related to the cybersecurity incident have begun in the Northern District of Georgia. In addition to these federal court proceedings, four putative class actions arising from the cybersecurity incident have been filed in the Fulton County Superior Court in Georgia. We have also appeared or notified the appropriate parties of representation in the Canadian class actions, but such actions are all at the preliminary stages. In addition, a civil enforcement action has been filed by the Attorney General of Massachusetts and a lawsuit has been filed by the City of San Francisco, each of which are in the initial pre-trial stages. We dispute the allegations in the complaints described above and intend to defend against such claims.
In addition, we continue to cooperate with federal, state, city and foreign governmental agencies and officials investigating or otherwise seeking information and/or documents, including through Civil Investigative Demands, regarding the cybersecurity incident and related matters, including 49 state Attorneys General offices, as well as the District of Columbia, the Federal Trade Commission, the Consumer Finance Protection Bureau, the U.S. Securities and Exchange Commission (“SEC”), the U.S. Department of Justice, the New York Department of Financial Services, the New York Department of State - Division of Consumer Protection, other U.S. state regulators, including state banking regulators, the Financial Industry Regulatory Authority, certain Congressional committees of both the U.S. Senate and House of Representatives, the United Kingdom’s Financial Conduct Authority (“FCA”), the Information Commissioner’s Office in the United Kingdom and the Office of the Privacy Commissioner of Canada. Although we are actively cooperating with these investigations and inquiries, an adverse outcome to any such investigations and inquiries could subject us to fines or other obligations, which may have an adverse effect on how we operate our business or our results of operations. In addition, we continue to cooperate with the SEC and the U.S. Attorney’s Office for the Northern District of Georgia regarding investigations into the trading activities by certain of our employees in relation to the cybersecurity incident.
TransUnion Litigation. On November 27, 2017, Trans Union LLC and TransUnion Interactive, Inc. (collectively, “TransUnion”) filed a lawsuit in the U.S. District Court for the Northern District of Illinois against Equifax Information Services LLC, Equifax Inc., and Equifax Consumer Services LLC f/k/a Equifax Consumer Services, Inc. In its lawsuit, TransUnion asserts claims for declaratory relief, breach of contract, and anticipatory repudiation of contract based on our Reciprocal Data Supply Agreement (the “Agreement”), which sets forth the pricing terms for credit monitoring supplied by the parties to each other. TransUnion seeks a declaration regarding its contractual rights under the Agreement and monetary damages. On January 26, 2018, we moved to dismiss TransUnion’s claims, and discovery in the case has been stayed until a ruling on that motion is issued. We dispute the allegations by TransUnion and intend to defend against its claims.
Securities Class Action Litigation. A consolidated putative class action lawsuit alleging violations of the federal securities laws in connection with statements regarding our cybersecurity systems and controls is pending against us and certain of our current and former officers and directors in the Northern District of Georgia. The complaints seek certification of a class of all persons who purchased or otherwise acquired Equifax securities during a set period of time and unspecified monetary damages, costs and attorneys’ fees. We dispute the allegations in these complaints and intend to defend against the claims.
Shareholder Derivative Litigation. Four putative shareholder derivative lawsuits have been commenced in the Northern District of Georgia naming certain of our current and former officers and directors as defendants and naming us as a nominal defendant. Among other things, the complaints allege claims for breaches of fiduciary duties, unjust enrichment, corporate waste, and insider selling by certain defendants. Three of the complaints also allege claims for violations of certain federal securities laws. The Complaints seek unspecified damages on behalf of the Company, plus certain equitable relief. Certain plaintiffs have filed motions seeking consolidation of the actions and appointment as lead plaintiffs. We have appointed
a committee of independent directors empowered to evaluate and respond in our best interests to the claims and related litigation demands.
It is not possible at this time to estimate the amount of loss or range of possible loss that might result from adverse judgments, settlements, penalties or other resolution of the above described proceedings and investigations based on the early stage of these proceedings and investigations, that alleged damages have not been specified, the uncertainty as to the certification of a class or classes and the size of any certified class, as applicable, and the lack of resolution on significant factual and legal issues.
Additional lawsuits and claims related to the 2017 cybersecurity incident may be asserted by or on behalf of consumers, customers, shareholders or others seeking damages or other related relief and additional inquiries from governmental agencies may be received or investigations by governmental agencies commenced.
ACCC Investigation. In March 2017, the Australian Competition and Consumer Commission (the “ACCC”) commenced an investigation to determine whether the Company has been or is engaged in unlawful acts or practices relating to advertising, marketing and sale of consumer reports, credit scores or credit monitoring products in violation of the Australian Consumer Law, which prohibits misleading or deceptive conduct and false representations. The ACCC issued a number of notices to produce documents and information. The Company expects that the ACCC will commence proceedings. If this occurs the ACCC may seek restitution, civil monetary penalties, injunctive and declaratory relief or other corrective action. The Company continues to cooperate with the ACCC in its investigation.
California Bankruptcy Litigation. In consolidated actions filed in the U.S. District Court for the Central District of California, captioned Terri N. White, et al. v. Equifax Information Services LLC, Jose Hernandez v. Equifax Information Services LLC, Kathryn L. Pike v. Equifax Information Services LLC, and Jose L. Acosta, Jr., et al. v. Trans Union LLC, et al., plaintiffs asserted that Equifax violated federal and state law (the FCRA, the California Credit Reporting Act and the California Unfair Competition Law) by failing to follow reasonable procedures to determine whether credit accounts are discharged in bankruptcy, including the method for updating the status of an account following a bankruptcy discharge. On August 20, 2008, the District Court approved a Settlement Agreement and Release providing for certain changes in the procedures used by defendants to record discharges in bankruptcy on consumer credit files. That settlement resolved claims for injunctive relief, but not plaintiffs’ claims for damages. On May 7, 2009, the District Court issued an order preliminarily approving an agreement to settle remaining class claims. The District Court subsequently deferred final approval of the settlement and required the settling parties to send a supplemental notice to those class members who filed a claim and objected to the settlement or opted out, with the cost for the re-notice to be deducted from the plaintiffs’ counsel fee award. Mailing of the supplemental notice was completed on February 15, 2011 and the deadline for this group of settling plaintiffs to provide additional documentation to support their damage claims or to opt-out of the settlement was March 31, 2011. On July 15, 2011, the District Court approved the settlement. Several objecting plaintiffs subsequently filed notices of appeal to the U.S. Court of Appeals for the Ninth Circuit, which, on April 22, 2013, issued an order vacating the settlement and remanding the case to the District Court for further proceedings. On January 21, 2014, the District Court denied the objecting plaintiffs’ motion to disqualify counsel for the settling plaintiffs and granted the motion of counsel for the settling plaintiffs to be appointed as interim lead class counsel. On March 28, 2016, the U.S. Court of Appeals for the Ninth Circuit affirmed the District Court’s lead counsel appointment. On January 9, 2017, the United States Supreme Court denied the objectors’ Petition for a Writ of Certiorari. The parties re-engaged in settlement discussions, including participation in mediations in August 2016 and November 2016, and reached an agreement to again settle the monetary claims. Settlement documents were filed with the District Court on April 14, 2017. On June 16, 2017, the Court granted preliminary approval of the proposed settlement, conditionally certified the settlement class, and appointed class counsel and administrator. A Final Fairness Hearing was held on December 11, 2017. Upon issuance of a Final Order by the Court, any appeals will be due within thirty days.
Other. Equifax has been named as a defendant in various other legal actions, including administrative claims, regulatory matters, government investigations, class actions and other litigation arising in connection with our business. Some of the legal actions include claims for substantial compensatory or punitive damages or claims for indeterminate amounts of damages. We believe we have defenses to and, where appropriate, will contest, many of these matters. Given the number of these matters, some are likely to result in adverse judgments, penalties, injunctions, fines or other relief. We may explore potential settlements before a case is taken through trial because of the uncertainty and risks inherent in the litigation process.
For information regarding our accounting for legal contingencies, see Note 6 of the Notes to Consolidated Financial Statements in this Form 10-K.
ITEM 4. MINE SAFETY DISCLOSURES
Not applicable.
PART II
ITEM 5. MARKET FOR THE REGISTRANT’S COMMON EQUITY, RELATED STOCKHOLDER MATTERS AND ISSUER PURCHASES OF EQUITY SECURITIES
Equifax’s common stock is traded on the New York Stock Exchange under the symbol “EFX.” As of January 31, 2018, Equifax had approximately 2,206 holders of record; however, Equifax believes the number of beneficial owners of common stock exceeds this number.
The table below sets forth the high and low sales prices per share of Equifax common stock, as reported on the New York Stock Exchange, for each quarter in the last two fiscal years and dividends declared per share:
|
| | | | | | | | | | | |
| High Sales Price | | Low Sales Price | | Dividends (1) |
2017 | | | | | |
First Quarter | $ | 137.76 |
| | $ | 116.31 |
| | $ | 0.39 |
|
Second Quarter | $ | 144.00 |
| | $ | 131.62 |
| | $ | 0.39 |
|
Third Quarter | $ | 147.02 |
| | $ | 89.59 |
| | $ | 0.39 |
|
Fourth Quarter | $ | 120.77 |
| | $ | 105.31 |
| | $ | 0.39 |
|
| | | | | |
2016 | | | | | |
First Quarter | $ | 114.67 |
| | $ | 91.72 |
| | $ | 0.33 |
|
Second Quarter | $ | 128.41 |
| | $ | 113.09 |
| | $ | 0.33 |
|
Third Quarter | $ | 136.97 |
| | $ | 127.85 |
| | $ | 0.33 |
|
Fourth Quarter | $ | 134.56 |
| | $ | 110.87 |
| | $ | 0.33 |
|
| |
(1) | Equifax’s Senior Credit Facilities, as defined in Note 5 of the Notes to Consolidated Financial Statements in this Form 10-K, restricts our ability to pay cash dividends on our capital stock or repurchase capital stock if a default exists or would result according to the terms of the credit agreement. |
We anticipate continuing the payment of quarterly cash dividends. The actual amount of such dividends is subject to declaration by our Board of Directors and will depend upon future earnings, results of operations, capital requirements, our financial condition and other relevant factors. There can be no assurance that the Company will continue to pay quarterly cash dividends at current levels or at all.
Shareholder Return Performance Graph
The graph below compares Equifax’s five-year cumulative total shareholder return with that of the Standard & Poor’s Composite Stock Index (S&P 500) and a peer group index, the S&P 500 Banks Index (Industry Group). The graph assumes that the value of the investment in our Common Stock and each index was $100 on the last trading day of 2012 and that all quarterly dividends were reinvested without commissions. Our past performance may not be indicative of future performance.
COMPARATIVE FIVE-YEAR CUMULATIVE TOTAL RETURN AMONG EQUIFAX INC., S&P 500 INDEX, AND S&P 500 BANKS INDEX (INDUSTRY GROUP)
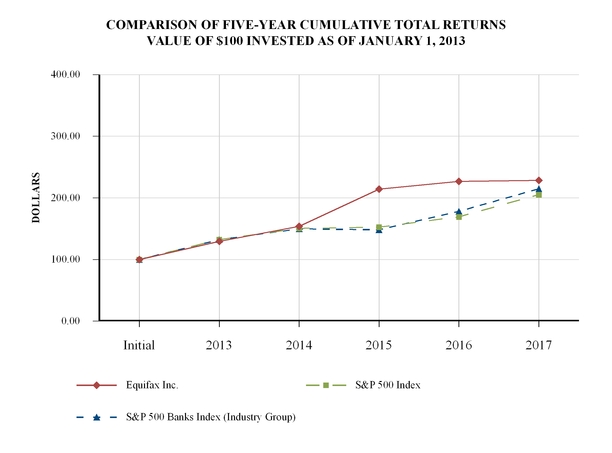
|
| | | | | | | | | | | | | | | | | |
| Fiscal Year Ended December 31, |
| Initial | | 2013 | | 2014 | | 2015 | | 2016 | | 2017 |
Equifax Inc. | 100.00 |
| | 129.52 |
| | 153.68 |
| | 214.06 |
| | 226.90 |
| | 228.22 |
|
S&P 500 Index | 100.00 |
| | 132.39 |
| | 150.51 |
| | 152.59 |
| | 169.24 |
| | 205.24 |
|
S&P 500 Banks Index (Industry Group) | 100.00 |
| | 132.25 |
| | 149.79 |
| | 148.23 |
| | 178.13 |
| | 214.75 |
|
The table below contains information with respect to purchases made by or on behalf of Equifax of its common stock during the fourth quarter ended December 31, 2017:
Issuer Purchases of Equity Securities
|
| | | | | | | | | | | | | | |
Period | | Total Number of Shares Purchased (1) | | Average Price Paid Per Share (2) | | Total Number of Shares Purchased as Part of Publicly-Announced Plans or Programs | | Maximum Number (or Approximate Dollar Value) of Shares that May Yet Be Purchased Under the Plans or Programs (3) |
October 1 - October 31, 2017 | | 48,395 |
| | $ | — |
| | — |
| | $ | 590,092,166 |
|
November 1 - November 30, 2017 | | 450 |
| | $ | — |
| | — |
| | $ | 590,092,166 |
|
December 1 - December 31, 2017 | | 958 |
| | $ | — |
| | — |
| | $ | 590,092,166 |
|
Total | | 49,803 |
| | $ | — |
| | — |
| | $ | 590,092,166 |
|
| |
(1) | The total number of shares purchased includes: (a) shares purchased pursuant to our publicly-announced share repurchase program, or Program; and (b) shares surrendered, or deemed surrendered, in satisfaction of the exercise price and/or to satisfy tax withholding obligations in connection with the exercise of employee stock options and vesting of restricted stock, totaling 48,395 shares for the month of October 2017, 450 shares for the month of November 2017 and 958 shares for the month of December 2017. |
| |
(2) | Average price paid per share for shares purchased as part of our Program (includes brokerage commissions). |
| |
(3) | Under the Program, we repurchased 0.5 million common shares during the twelve months ended December 31, 2017 for $77.1 million. At December 31, 2017, the amount authorized for future share repurchases under the Program was $590.1 million. |
Information relating to compensation plans under which the Company’s equity securities are authorized for issuance is included in the section captioned “Equity Compensation Plan Information” in our 2018 Proxy Statement and is incorporated herein by reference.
ITEM 6. SELECTED FINANCIAL DATA
The table below summarizes our selected historical financial information for each of the last five years. The summary of operations data for the years ended December 31, 2017, 2016, 2015, and the balance sheet data as of December 31, 2017 and 2016, have been derived from our audited Consolidated Financial Statements included in this report. The summary of operations data for the years ended December 31, 2014 and 2013, and the balance sheet data as of December 31, 2015, 2014 and 2013, have been derived from our audited Consolidated Financial Statements not included in this report. The historical selected financial information may not be indicative of our future performance and should be read in conjunction with the information contained in Management’s Discussion and Analysis of Financial Condition and Results of Operations, and the Consolidated Financial Statements and the accompanying Notes to the Consolidated Financial Statements in this report.
|
| | | | | | | | | | | | | | | | | | | |
| Twelve Months Ended December 31, |
| 2017 (1) (2) | | 2016 (3) | | 2015 (4)(5) | | 2014 (6) | | 2013(7)(8) |
| (In millions, except per share data) |
Summary of Operations: | | | | | | | | | |
Operating revenue | $ | 3,362.2 |
| | $ | 3,144.9 |
| | $ | 2,663.6 |
| | $ | 2,436.4 |
| | $ | 2,303.9 |
|
Operating expenses | 2,537.6 |
| | 2,327.0 |
| | 1,969.7 |
| | 1,798.2 |
| | 1,692.7 |
|
Operating income | 824.6 |
| | 817.9 |
| | 693.9 |
| | 638.2 |
| | 611.2 |
|
Consolidated income from continuing operations | 598.0 |
| | 495.1 |
| | 434.8 |
| | 374.0 |
| | 341.5 |
|
Discontinued operations, net of tax (7) | — |
| | — |
| | — |
| | — |
| | 18.4 |
|
Net income attributable to Equifax | $ | 587.3 |
| | $ | 488.8 |
| | $ | 429.1 |
| | $ | 367.4 |
| | $ | 351.8 |
|
| | | | | | | | | |
Dividends paid to Equifax shareholders | $ | 187.4 |
|
| $ | 157.6 |
|
| $ | 137.8 |
|
| $ | 121.2 |
|
| $ | 106.7 |
|
Diluted earnings per share |
|
|
|
|
|
|
|
|
|
|
|
|
|
|
Net income from continuing operations attributable to Equifax | $ | 4.83 |
|
| $ | 4.04 |
|
| $ | 3.55 |
|
| $ | 2.97 |
|
| $ | 2.69 |
|
Discontinued operations attributable to Equifax | — |
|
| — |
|
| — |
|
| — |
|
| 0.15 |
|
Net income attributable to Equifax | $ | 4.83 |
|
| $ | 4.04 |
|
| $ | 3.55 |
|
| $ | 2.97 |
|
| $ | 2.84 |
|
Cash dividends declared per share | $ | 1.56 |
|
| $ | 1.32 |
|
| $ | 1.16 |
|
| $ | 1.00 |
|
| $ | 0.88 |
|
Weighted-average shares outstanding (diluted) | 121.5 |
|
| 121.1 |
|
| 120.9 |
|
| 123.5 |
|
| 123.7 |
|
|
| | | | | | | | | | | | | | | | | | | |
| As of December 31, |
| 2017 (1) (2) | | 2016 (3) | | 2015 (4)(5) | | 2014 (6) | | 2013(7)(8) |
| (In millions) |
Balance Sheet Data: | | | | | | | | | |
Total assets | $ | 7,233.4 |
|
| $ | 6,664.0 |
|
| $ | 4,501.5 |
|
| $ | 4,661.0 |
|
| $ | 4,522.5 |
|
Short-term debt and current maturities | 965.3 |
|
| 585.4 |
|
| 49.3 |
|
| 380.4 |
|
| 296.5 |
|
Long-term debt, net of current portion | 1,739.0 |
|
| 2,086.8 |
|
| 1,138.4 |
|
| 1,145.7 |
|
| 1,145.5 |
|
Total debt, net | 2,704.3 |
|
| 2,672.2 |
|
| 1,187.7 |
|
| 1,526.1 |
|
| 1,442.0 |
|
Total equity | 3,239.0 |
|
| 2,721.3 |
|
| 2,350.4 |
|
| 2,234.6 |
|
| 2,341.0 |
|
| |
(1) | Through December 31, 2017, the Company recorded $164.0 million of pretax expenses related to the cybersecurity incident and insurance recoveries of $50.0 million for net expenses of $114.0 million. We included $14.2 million of these expenses in Cost of services and $99.8 million in Selling, general and administrative expenses in the accompanying Consolidated Statements of Income for the year ended December 31, 2017. Expenses include costs to investigate and remediate the cybersecurity incident and legal and other professional services related thereto, all of which were expensed as incurred. Additionally, as a result of the cybersecurity incident, we offered free credit file monitoring and identity theft protection to all U.S. consumers. We have recorded the expenses necessary to provide this |
service to those who signed up. For additional information, see Note 6 of the Notes to the Consolidated Financial Statements in this report.
| |
(2) | The Tax Cuts and Jobs Act of 2017 (“Tax Act”), as signed by the President of the United States on December 22, 2017, significantly revises U.S. tax law. The legislation will positively impact the Company’s ongoing effective tax rate due to the reduction of the U.S. federal corporate tax rate from 35% to 21%. The Tax Act makes major changes to the U.S. international tax system. Under previous law, foreign earnings were subject to U.S. tax when repatriated to the U.S. Under the Tax Act, foreign earnings are generally exempt from U.S. tax. Additionally, there is a one-time deemed repatriation tax on undistributed foreign earnings and profits (the “transition tax”). The Tax Act imposes other U.S. taxes on “global intangible low taxed income” and “base erosion anti-abuse transactions.” Other significant changes include limitations on the deductibility of interest expense and executive compensation, and repeal of the deduction for domestic production activities. As a result of the current interpretation and estimated impact of the Tax Act, the Company recorded adjustments totaling a net tax benefit of $48.3 million in the fourth quarter of 2017 to provisionally account for the estimated impact. Refer to Note 7 of the Notes to the Consolidated Financial Statements in this Form 10-K for additional information. We also prospectively applied the provisions of ASU 2016-09 "Compensation - Stock Compensation (Topic 718)," related to the recognition of windfall tax benefits in the Consolidated Statement of Income which resulted in the recognition of $26.7 million of tax benefits for the year ended December 31, 2017. |
| |
(3) | In the first quarter of 2016, we completed the acquisition of 100% of the ordinary voting shares of Veda for cash consideration plus debt assumed of approximately $1.9 billion. The acquisition provides a strong platform for Equifax to offer data and analytic services and further broaden the Company's geographic footprint. Additionally, on August 23, 2016, the Company completed the acquisition of 100% of the assets and certain liabilities of unemployment tax and claims management specialists Barnett & Associates ("Barnett"), as well as the verifications business, Computersoft, LLC ("Computersoft"). For the year ended December 31, 2016, we recorded $40.2 million ($28.2 million, net of tax) for Veda acquisition related amounts. Of this amount, $30.1 million relates to transaction and integration costs in operating income, $9.2 million is recorded in other income and is the impact of foreign currency changes on the transaction structure, including the economic hedges, $0.2 million is recorded in depreciation and amortization, and $0.7 million is recorded in interest expense. For additional information, see Note 3 of the Notes to the Consolidated Financial Statements in this report. |
| |
(4) | In the first quarter of 2015, we recorded a $20.7 million restructuring charge ($13.2 million, net of tax) all of which was recorded in Selling, general and administrative expenses on our Consolidated Statements of Income. This charge resulted from our continuing efforts to realign our internal resources to support the Company’s strategic objectives and increase the integration of our global operations. For additional information, see Note 12 of the Notes to Consolidated Financial Statements in this report. |
| |
(5) | During the second quarter of 2015, the management of Boa Vista Servicos S.A. ("BVS"), in which we hold a 15% cost method investment, updated the financial projections of BVS. The updated projections, along with the continued weakness in the Brazilian consumer and small commercial credit markets were considered indicators of impairment. As a result of these changes, and the associated near-term changes in cash flow expected from the business, we recorded a 46.0 million Brazilian Reais ($14.8 million) impairment of our investment. For additional information, see Note 2 of the Notes to Consolidated Financial Statements in this report. |
| |
(6) | During the first quarter of 2014, we acquired 100% of the stock of TDX, a data, technology and services company in the United Kingdom that specializes in debt collections and recovery management through the use of analytics, data exchanges and technology platforms. The results of this acquisition have been included in our USIS and International operating segments subsequent to the acquisition. We also purchased Forseva, a provider of end-to-end, cloud-based credit-management software solutions. The results of this acquisition have been included in our USIS operating segment subsequent to the acquisition. |
| |
(7) | During the first quarter of 2013, we divested two non-strategic business lines, Equifax Settlement Services, which was part of our Mortgage business within the USIS operating segment, and Talent Management Services, which was part of our Employer Services business within our Workforce Solutions operating segment, for a total of $47.5 million. We have presented the Equifax Settlement Services and Talent Management Services operations as discontinued operations for all periods presented. |
| |
(8) | During the fourth quarter of 2013, the management of BVS, in which we hold a 15% cost method investment, revised its near-term outlook and its operating plans to reflect reduced near-term market expectations for credit information services in Brazil and increased investment needed to achieve its strategic objectives. As a result of these changes, and the |
associated near-term changes in cash flow expected from the business, we recorded a 40 million Brazilian Reais ($17.0 million) impairment of our original investment of 130 million Brazilian Reais. For additional information, see Note 2 of the Notes to Consolidated Financial Statements in this report.
ITEM 7. MANAGEMENT’S DISCUSSION AND ANALYSIS OF FINANCIAL CONDITION AND RESULTS OF OPERATIONS
As used herein, the terms Equifax, the Company, we, our and us refer to Equifax Inc., a Georgia corporation, and its consolidated subsidiaries as a combined entity, except where it is clear that the terms mean only Equifax Inc.
All references to earnings per share data in Management’s Discussion and Analysis, or MD&A, are to diluted earnings per share, or EPS, unless otherwise noted. Diluted EPS is calculated to reflect the potential dilution that would occur if stock options or other contracts to issue common stock were exercised and resulted in additional common shares outstanding.
BUSINESS OVERVIEW
We are a leading global provider of information solutions, employment and income verifications and human resources business process outsourcing services. We leverage some of the largest sources of consumer and commercial data, along with advanced analytics and proprietary technology, to create customized insights which enable our business customers to grow faster, more efficiently and more profitably, and to inform and empower consumers.
Businesses rely on us for consumer and business credit intelligence, credit portfolio management, fraud detection, decisioning technology, marketing tools, debt management and human resources-related services. We also offer a portfolio of products that enable individual consumers to manage their financial affairs and protect their identity. Our revenue stream is diversified among businesses across a wide range of industries, international geographies and individual consumers.
2017 Cybersecurity Incident
In fiscal 2017, we experienced a cybersecurity incident following a criminal attack on our systems that involved the theft of certain personally identifiable information of U.S., Canadian and U.K. consumers. Criminals exploited a U.S. website application vulnerability to gain unauthorized access to our network. Based on our forensic investigation, the unauthorized access of information occurred from mid-May through July 2017. The information accessed primarily includes names, Social Security numbers, birth dates, addresses and, in some instances, driver’s license numbers. In addition, credit card numbers for approximately 209,000 U.S. and Canadian consumers, and certain dispute documents with personal identifying information for approximately 182,000 U.S. consumers, were accessed. The investigation determined that personal information of approximately 19,000 Canadian consumers was impacted and approximately 860,000 potentially affected U.K. consumers were contacted regarding access to personal information. The forensic investigation of the cybersecurity incident was, as previously disclosed, completed in the fourth quarter of fiscal 2017. No evidence was found that the Company's core consumer, employment and income, or commercial credit reporting databases were accessed.
The Company acted promptly to notify the approximately 145.5 million U.S. consumers whose personally identifiable information the Company had identified in 2017 as potentially accessed. As a result of an ongoing analysis of data stolen in the 2017 cybersecurity incident, the Company recently announced that it was able to identify approximately 2.4 million U.S. consumers whose name and partial driver’s license information were stolen, but who were not in the affected population of approximately 145.5 million consumers previously identified by the Company in 2017. The Company is in the process of notifying these additional consumers.
As a result of the 2017 cybersecurity incident, we are party to numerous lawsuits and governmental investigations. See Part I, Item 1A. Risk Factors and Part I, Item 3. Legal Proceedings for more information regarding these lawsuits and investigations. We continue to cooperate with law enforcement in connection with the criminal investigation into the actors responsible for the cybersecurity incident.
Expenses Incurred. Through December 31, 2017, the Company recorded $113.3 million of pretax expenses related to the cybersecurity incident. We have included $14.2 million of these expenses in Cost of services and $99.1 million in Selling, general and administrative expenses in the accompanying Consolidated Statements of Income for the year ended December 31, 2017. Expenses include costs to investigate and remediate the cybersecurity incident and legal and other professional services related thereto, all of which were expensed as incurred.
Product Liability. Additionally, as a result of the cybersecurity incident, we offered free credit file monitoring and identity theft protection to all U.S. consumers. We have recorded the expenses necessary to provide this service to those who signed up. We have recorded $50.7 million through December 31, 2017 included in Selling, general and administrative expenses in the accompanying Consolidated Statements of Income.
Litigation, Claims and Government Investigations. As a result of the cybersecurity incident, we are subject to a significant number of proceedings and investigations as described in Part I, "Item 3. Legal Proceedings." While we believe it is reasonably possible that we will incur losses associated with these proceedings and investigations, it is not possible to estimate the amount of loss or range of possible loss that might result from adverse judgments, settlements, penalties or other resolution of such proceedings and investigations based on the early stage of these proceedings and investigations, that alleged damages have not been specified, the uncertainty as to the certification of a class or classes and the size of any certified class, as applicable, and the lack of resolution on significant factual and legal issues. The Company will continue to evaluate information as it becomes known and will record an estimate for losses at the time or times when it is both probable that a loss has been incurred and the amount of the loss is reasonably estimable. The Company believes that the ultimate amount paid on these actions, claims and investigations could be material to the Company’s consolidated financial condition, results of operations, or cash flows in future periods.
Future Costs. We expect to incur significant legal and other professional services expenses associated with the cybersecurity incident in future periods. We will recognize these expenses as services are received. Costs related to the cybersecurity incident that will be incurred in future periods will also include increased expenses and capital investments for IT and security. We expect to incur increased expenses for insurance, finance, compliance activities, and to meet increased legal and regulatory requirements. We will also incur increased costs to provide free services to consumers including increased customer support costs.
Insurance Coverage. We maintain $125 million of cybersecurity insurance coverage, above a $7.5 million deductible, to limit our exposure to losses such as those related to the cybersecurity incident. As of December 31, 2017, the Company has recorded a receivable of $35.0 million and received payments of $15 million for costs incurred to date that are reimbursable and probable of recovery under our insurance coverage.
Segment and Geographic Information
Segments. The USIS segment, the largest of our four segments, consists of three service lines: Online Information Solutions; Mortgage Solutions; and Financial Marketing Services. Online Information Solutions and Mortgage Solutions revenue is principally transaction-based and is derived from our sales of products such as consumer and commercial credit reporting and scoring, identity management, fraud detection and modeling services. USIS also markets certain decisioning software services, which facilitate and automate a variety of consumer and commercial credit-oriented decisions. Financial Marketing Services revenue is principally project and subscription based and is derived from our sales of batch credit and consumer wealth information such as those that assist clients in acquiring new customers, cross selling to existing customers and managing portfolio risk.
The International segment consists of Asia Pacific, Europe, Latin America and Canada. Canada’s services are similar to our USIS offerings. Asia Pacific, Europe and Latin America are made up of varying mixes of service lines that are generally in our USIS reportable segment. We also provide information and technology services to support lenders and other creditors in the collections and recovery management process.
The Workforce Solutions segment consists of the Verification Services and Employer Services business lines. Verification Services revenue is transaction-based and is derived primarily from employment and income verification. Employer Services revenues are derived from our provision of certain human resources business process outsourcing services that include both transaction and subscription based product offerings. These services include unemployment claims management, employment-based tax credit services and other complementary employment-based transaction services.
Global Consumer Solutions revenue is both transaction and subscription based and is derived from the sale of credit monitoring and identity theft protection products, which we deliver electronically to consumers primarily via the internet in the U.S., Canada, and the U.K. We reach consumers directly and indirectly through partners. We also sell consumer and credit information to resellers who combine our information with other information to provide direct to consumer monitoring, reports and scores. Due to the cybersecurity incident we ceased advertising our consumer business in the U.S. in September 2017. As part of our response to the cybersecurity incident announced in September 2017, we began offering in the U.S. our TrustedID Premier service, an identity theft protection and credit file monitoring product, for free to all consumers who signed up through January 31, 2018. Additionally, in January 2018, the Company introduced in the U.S., Lock & AlertTM, a new service that allows customers to quickly lock and unlock their Equifax credit report for free, for life. Equifax also will provide the ability for U.S. consumers to freeze and unfreeze their Equifax credit file for free through June 30, 2018. We provide U.S. consumers with a free annual credit report in accordance with the FACT Act. For consumers impacted by the cybersecurity incident in Canada and the U.K., we are providing free credit reports and scores, credit monitoring and identity theft protection for 12 months for those consumers who signed up by January 31, 2018.
Geographic Information. We currently have significant operations in the following countries: Argentina, Australia, Canada, Chile, Costa Rica, Ecuador, El Salvador, Honduras, India, Mexico, New Zealand, Paraguay, Peru, Portugal, the Republic of Ireland, Spain, the U.K., Uruguay and the U.S. We also offer Equifax branded credit services in India and Russia through joint ventures, we have investments in consumer and/or commercial credit information companies through joint ventures in Cambodia, Malaysia, Singapore and Dubai, and have an investment in a consumer and commercial credit information company in Brazil. Approximately 71% of our revenue was generated in the U.S. during the twelve months ended December 31, 2017.
Key Performance Indicators. Management focuses on a variety of key indicators to monitor operating and financial performance. These performance indicators include measurements of operating revenue, change in operating revenue, operating income, operating margin, net income, diluted earnings per share, cash provided by operating activities and capital expenditures. Key performance indicators for the twelve months ended December 31, 2017, 2016 and 2015, include the following: |
| | | | | | | | | | | |
| Key Performance Indicators Twelve Months Ended December 31, |
| 2017 | | 2016 | | 2015 |
| (In millions, except per share data) |
Operating revenue | $ | 3,362.2 |
| | $ | 3,144.9 |
| | $ | 2,663.6 |
|
Operating revenue change | 7 | % | | 18 | % | | 9 | % |
Operating income | $ | 824.6 |
| | $ | 817.9 |
| | $ | 693.9 |
|
Operating margin | 24.5 | % | | 26.0 | % | | 26.1 | % |
Net income attributable to Equifax | $ | 587.3 |
| | $ | 488.8 |
| | $ | 429.1 |
|
Diluted earnings per share | $ | 4.83 |
| | $ | 4.04 |
| | $ | 3.55 |
|
Cash provided by operating activities | $ | 816.0 |
| | $ | 823.0 |
| | $ | 769.1 |
|
Capital expenditures* | $ | (214.0 | ) | | $ | (191.5 | ) | | $ | (150.7 | ) |
*Amounts above exclude changes in accruals for capital expenditures.
Business Environment and Company Outlook
Demand for our services tends to be correlated to general levels of economic activity and to consumer credit activity, small commercial credit and marketing activity. Demand is also enhanced by our initiatives to expand our products, capabilities, and markets served. In the United States we expect 2018 economic activity, as measured by GDP, to be about flat with levels seen in the second half of 2017. We expect modest growth in consumer credit, excluding mortgage, over the course of 2018. U.S. Mortgage market originations are expected to be down for the full year of 2018 versus 2017. We anticipate 2018 economic activity, as measured by GDP, in Canada and Australia to be at or slightly below the levels seen in the second half of 2017. In the European markets we serve, the U.K. and Spain, we are expecting 2018 economic activity, as measured by GDP, to be at or slightly below the levels in calendar year 2017. In Argentina and Chile, our two largest markets in our Latin American Region, we are expecting 2018 economic activity, again as measured by GDP, to increase from the levels in calendar year 2017.
The cybersecurity incident announced in the third quarter of 2017 is expected to negatively impact revenue, principally in our U.S. businesses, and to a lesser extent in Canada and the U.K., in 2018. We will also incur, in 2018, legal, consulting and other costs related to the analysis and response to the cybersecurity incident. In 2018, we will incur costs and capital expenditures for providing the free TrustedID credit file monitoring and identity theft protection, and free Lock & AlertTM, to U.S. consumers, as well as services to U.K. and Canadian consumers. Additionally, in 2018 and beyond, we will incur increased information technology and security costs and capital expenditures related to actions to improve information technology security and network resilience globally. In 2018 and beyond, we will have increases in the ongoing run-rate of IT and security spending. We also expect to incur increased expenses for insurance, finance, compliance activities, and to meet increased legal and regulatory requirements. We also expect to incur increased costs to provide free services to consumers, including increased customer support costs. The ultimate amount of these increases is yet to be determined but we expect them to be significant.
As a result of the cybersecurity incident, we are subject to a significant number of proceedings and investigations as described in Part I, "Item 3. Legal Proceedings." While we believe it is reasonably possible that we will incur losses associated
with these proceedings and investigations, it is not possible to estimate the amount of loss or range of possible loss that might result from adverse judgments, settlements, penalties or other resolution of such proceedings and investigations based on the early stage of these proceedings and investigations, that alleged damages have not been specified, the uncertainty as to the certification of a class or classes and the size of any certified class, as applicable, and the lack of resolution on significant factual and legal issues.
The Tax Cuts and Jobs Act of 2017 (“Tax Act”), as signed by the President of the United States on December 22, 2017, significantly revises U.S. tax law. The legislation will positively impact the Company’s ongoing effective tax rate due to the reduction of the U.S. federal corporate tax rate from 35% to 21%. The Tax Act makes major changes to the U.S. international tax system. Under previous law, foreign earnings were subject to U.S. tax when repatriated to the U.S. Under the Tax Act, foreign earnings are generally exempt from U.S. tax. Additionally, there is a one-time deemed repatriation tax on undistributed foreign earnings and profits (the “transition tax”). The Tax Act imposes other U.S. taxes on “global intangible low taxed income” and “base erosion anti-abuse transactions.” Other significant changes include limitations on the deductibility of interest expense and executive compensation, and repeal of the deduction for domestic production activities. As a result of the current interpretation and estimated impact of the Tax Act, the Company recorded adjustments totaling a net tax benefit of $48.3 million in the fourth quarter of 2017 to provisionally account or the estimated impact. Refer to Note 7 of the Notes to the Consolidated Financial Statements in this Form 10-K for additional information.
RESULTS OF OPERATIONS —
TWELVE MONTHS ENDED DECEMBER 31, 2017, 2016 AND 2015
Consolidated Financial Results
Operating Revenue
|
| | | | | | | | | | | | | | | | | | | | | | | | | | |
| | Twelve Months Ended December 31, | | Change |
| | | | | | | | 2017 vs. 2016 | | 2016 vs. 2015 |
Operating Revenue | | 2017 | | 2016 | | 2015 | | $ | | % | | $ | | % |
| | (In millions) |
U.S. Information Solutions | | $ | 1,262.7 |
| | $ | 1,236.5 |
| | $ | 1,171.3 |
| | $ | 26.2 |
| | 2 | % | | $ | 65.2 |
| | 6 | % |
International | | 932.3 |
| | 803.6 |
| | 568.5 |
| | 128.7 |
| | 16 | % | | 235.1 |
| | 41 | % |
Workforce Solutions | | 764.2 |
| | 702.2 |
| | 577.7 |
| | 62.0 |
| | 9 | % | | 124.5 |
| | 22 | % |
Global Consumer Solutions | | 403.0 |
| | 402.6 |
| | 346.1 |
| | 0.4 |
| | — | % | | 56.5 |
| | 16 | % |
Consolidated operating revenue | | $ | 3,362.2 |
| | $ | 3,144.9 |
| | $ | 2,663.6 |
| | $ | 217.3 |
| | 7 | % | | $ | 481.3 |
| | 18 | % |
Revenue for 2017 increased by 7% compared to 2016. The growth was driven by our International and Workforce Solutions segments. International had strong growth across all regions, which reflects broad based organic growth and the Veda acquisition. Workforce Solutions saw strong growth driven by Verification Services. USIS had an increase in revenue compared to 2016, reflecting growth in core credit decisioning, financial marketing services, mortgage and identity and fraud solutions. Revenue in our USIS, Global Consumer Solutions and Workforce Solutions segments were negatively impacted by the cybersecurity incident. The effect of foreign exchange rates reduced revenue by $6.0 million in 2017 compared to 2016.
Revenue for 2016 increased by 18% compared to 2015. The growth was driven by broad-based organic growth due to revenue increases in mortgage, government, healthcare, and direct to consumer reseller verticals as well as the Veda acquisition. The effect of foreign exchange rates reduced revenue by $75.2 million or 3% in 2016 compared to 2015.
Operating Expenses
|
| | | | | | | | | | | | | | | | | | | | | | | | | | |
| | Twelve Months Ended December 31, | | Change |
| | | | | | | | 2017 vs. 2016 | | 2016 vs. 2015 |
Operating Expenses | | 2017 | | 2016 | | 2015 | | $ | | % | | $ | | % |
| | (In millions) |
Consolidated cost of services | | $ | 1,210.7 |
| | $ | 1,113.4 |
| | $ | 887.4 |
| | $ | 97.3 |
| | 9 | % | | $ | 226.0 |
| | 25 | % |
Consolidated selling, general and administrative expenses | | 1,039.1 |
| | 948.2 |
| | 884.3 |
| | 90.9 |
| | 10 | % | | 63.9 |
| | 7 | % |
Consolidated depreciation and amortization expense | | 287.8 |
| | 265.4 |
| | 198.0 |
| | 22.4 |
| | 8 | % | | 67.4 |
| | 34 | % |
Consolidated operating expenses | | $ | 2,537.6 |
| | $ | 2,327.0 |
| | $ | 1,969.7 |
| | $ | 210.6 |
| | 9 | % | | $ | 357.3 |
| | 18 | % |
Cost of Services. Cost of services increased $97.3 million in 2017 compared to 2016. The increase in cost of services, when compared to 2016, was due to the increase in production costs driven by higher revenues, as well as increases in professional services related to the cybersecurity incident and in people costs. The effect of changes in foreign exchange rates reduced cost of services by $2.1 million.
Cost of services increased $226.0 million in 2016 compared to 2015. The increase in cost of services, when compared to 2015, was due to the increase in production costs driven by higher revenues including the Veda acquisition, as well as increases in people costs, and to a lesser extent an increase in technology costs. The effect of changes in foreign exchange rates reduced cost of services by $21.4 million.
Selling, General and Administrative Expenses. Selling, general and administrative expenses increased $90.9 million in 2017 as compared to 2016. The increase was due to costs related to the cybersecurity incident, higher occupancy and people costs, partially offset by a decline in Veda integration and transaction costs. The impact of changes in foreign currency exchange rates decreased our selling, general and administrative expenses by $2.2 million.
Selling, general and administrative expenses increased $63.9 million in 2016 as compared to 2015. The increase was due to Veda selling, general and administrative expense and integration and transaction costs and increases in people costs across the business. The increase was offset by a decline in costs related to the realignment of internal resources. The impact of changes in foreign currency exchange rates decreased our selling, general and administrative expenses by $23.7 million.
Depreciation and Amortization. Depreciation and amortization expense for 2017 increased by $22.4 million primarily due to increased depreciation due to increased capital expenditures.
Depreciation and amortization expense for 2016 increased by $67.4 million primarily due to the Veda acquisition.
Operating Income and Operating Margin
|
| | | | | | | | | | | | | | | | | | | | | | | | | | |
| | Twelve Months Ended December 31, | | Change |
Operating Income and Operating Margin | | | | | | | | 2017 vs. 2016 | | 2016 vs. 2015 |
| 2017 | | 2016 | | 2015 | | $ | | % | | $ | | % |
| | (In millions) |
Consolidated operating revenue | | $ | 3,362.2 |
| | $ | 3,144.9 |
| | $ | 2,663.6 |
| | $ | 217.3 |
| | 7 | % | | $ | 481.3 |
| | 18 | % |
Consolidated operating expenses | | 2,537.6 |
| | 2,327.0 |
| | 1,969.7 |
| | 210.6 |
| | 9 | % | | 357.3 |
| | 18 | % |
Consolidated operating income | | $ | 824.6 |
| | $ | 817.9 |
| | $ | 693.9 |
| | $ | 6.7 |
| | 1 | % | | $ | 124.0 |
| | 18 | % |
Consolidated operating margin | | 24.5 | % | | 26.0 | % | | 26.1 | % | | |
| | (1.5 | )pts | | | (0.1 | )pts |
Total company margin decreased in 2017 versus 2016, primarily due to the costs related to the cybersecurity incident, partially offset by increased margins in International and Equifax Workforce Solutions business segments and lower integration costs related to the acquisition of Veda.
Total company margin decreased slightly in 2016 versus 2015 due to transaction and integration costs as well as increased amortization of acquired intangibles related to the acquisition of Veda. This was partially offset by a decline in costs related to realignment of internal resources. Margins in our USIS, Workforce Solutions and Global Consumer businesses all increased in 2016, with these increases offset by lower margins in International, principally due to the Veda transaction and integration costs and related amortization of intangibles.
Interest Expense and Other Income (Expense), net |
| | | | | | | | | | | | | | | | | | | | | | | | | | |
| | Twelve Months Ended December 31, | | Change |
| | | | | | | | 2017 vs. 2016 | | 2016 vs. 2015 |
Consolidated Interest and Other Income (Expense), net | | 2017 | | 2016 | | 2015 | | $ | | % | | $ | | % |
| | (In millions) |
Consolidated interest expense | | $ | (92.8 | ) | | $ | (92.1 | ) | | $ | (63.8 | ) | | $ | (0.7 | ) | | 1 | % | | $ | (28.3 | ) | | 44 | % |
Consolidated other income, net | | 14.8 |
| | 2.4 |
| | 6.5 |
| | 12.4 |
| | 517 | % | | (4.1 | ) | | (63 | )% |
| | | | | | | | | | | | | | |
Average cost of debt | | 3.4 | % | | 3.5 | % | | 4.5 | % | | |
| | |
| | |
| | |
|
Total consolidated debt, net, at year end | | $ | 2,704.3 |
| | $ | 2,672.2 |
| | $ | 1,187.7 |
| | $ | 32.1 |
| | 1 | % | | $ | 1,484.5 |
| | 125 | % |
Interest expense increased in 2017, when compared to 2016, due to an increase in our average consolidated debt outstanding in 2017, reflecting debt incurred in the first quarter of 2016 to finance the acquisition of Veda. Our average cost of debt decreased in 2017 compared to 2016, due to the higher balance of low rate commercial paper outstanding and lower long-term rates due to the repayment on July 3, 2017 of $272.5 million in principal amount of our 6.3% senior notes.
Interest expense increased in 2016, when compared to 2015, due to an overall increase in our consolidated debt outstanding as of December 31, 2016 to fund the acquisition of Veda in 2016. Our average cost of debt decreased in 2016 compared to 2015, due to the higher balance of low rate commercial paper outstanding and lower long-term rates related to the issuance of 2.3% and 3.25% Senior Notes.
The increase in other income (expense), net, in 2017 is primarily due to a 2016 loss on the economic hedges, offset by a foreign currency gain on intercompany debt, both items related to the Veda transaction which did not recur in 2017. There were also higher earnings on certain equity method investments in 2017.
The decrease in other income (expense), net, in 2016 is due to 2016 foreign exchange losses related to the Veda acquisition and the 2015 income from the settlement of escrow amounts related to an acquisition from January 2014 which did not recur in 2016. These items were partially offset by the impairment of our cost method investment in Brazil in the second quarter of 2015 which did not recur in 2016.
Income Taxes
|
| | | | | | | | | | | | | | | | | | | | | | | | | | |
| | Twelve Months Ended December 31, | | Change |
| | | | | | | | 2017 vs. 2016 | | 2016 vs. 2015 |
Provision for Income Taxes | | 2017 | | 2016 | | 2015 | | $ | | % | | $ | | % |
| | (In millions) |
Consolidated provision for income taxes | | $ | (148.6 | ) | | $ | (233.1 | ) | | $ | (201.8 | ) | | $ | 84.5 |
| | (36 | )% | | $ | (31.3 | ) | | 16 | % |
Effective income tax rate | | 19.9 | % | | 32.0 | % | | 31.7 | % | | |
| | |
| | |
| | |
|
Overall, our effective tax rate was 19.9% for 2017, down from 32.0% for the same period in 2016. The decrease in our effective income tax rate for 2017 is primarily attributable to recording the preliminary impact of the Tax Act enacted in the fourth quarter of 2017, and the adoption of the new stock-based compensation guidance we prospectively adopted in the first quarter of 2017. We recognized a $48.3 million and $26.7 million tax benefit related to the estimated impact of tax legislation enacted in 2017 and the accounting change for stock-based compensation guidance for the full year 2017, respectively.
Overall, our effective tax rate was 32.0% for 2016, up from 31.7% for the same period in 2015. The 2016 rate benefited by 2% due to international related items, specifically higher earnings in lower tax jurisdictions and the rationalization of the structure of foreign subsidiaries. This was offset by other non-recurring permanent items that benefited the 2015 tax rate including the settlement of escrow related to a past acquisition and state law changes, that did not recur in 2016.
Net Income |
| | | | | | | | | | | | | | | | | | | | | | | | | | |
| | Twelve Months Ended December 31, | | Change |
| | | | | | | | 2017 vs. 2016 | | 2016 vs. 2015 |
Net Income | | 2017 | | 2016 | | 2015 | | $ | | % | | $ | | % |
| | (In millions, except per share amounts) |
Consolidated operating income | | $ | 824.6 |
| | $ | 817.9 |
| | $ | 693.9 |
| | $ | 6.7 |
| | 1 | % | | $ | 124.0 |
| | 18 | % |
Consolidated other expense, net | | (78.0 | ) | | (89.7 | ) | | (57.3 | ) | | 11.7 |
| | (13 | )% | | (32.4 | ) | | 57 | % |
Consolidated provision for income taxes | | (148.6 | ) | | (233.1 | ) | | (201.8 | ) | | 84.5 |
| | (36 | )% | | (31.3 | ) | | 16 | % |
Consolidated net income | | 598.0 |
| | 495.1 |
| | 434.8 |
| | 102.9 |
| | 21 | % | | 60.3 |
| | 14 | % |
Net income attributable to noncontrolling interests | | (10.7 | ) | | (6.3 | ) | | (5.7 | ) | | (4.4 | ) | | 70 | % | | (0.6 | ) | | 11 | % |
Net income attributable to Equifax | | $ | 587.3 |
| | $ | 488.8 |
| | $ | 429.1 |
| | $ | 98.5 |
| | 20 | % | | $ | 59.7 |
| | 14 | % |
Diluted earnings per share: | | |
| | |
| | |
| | |
| | |
| | |
| | |
|
Net income attributable to Equifax | | $ | 4.83 |
| | $ | 4.04 |
| | $ | 3.55 |
| | $ | 0.79 |
| | 20 | % | | $ | 0.49 |
| | 14 | % |
Weighted-average shares used in computing diluted earnings per share | | 121.5 |
| | 121.1 |
| | 120.9 |
| | |
| | |
| | |
| | |
|
Consolidated net income increased by $102.9 million, or 21%, in 2017 compared to 2016 due to increased operating income, principally in our International, Workforce Solutions, and USIS businesses, partially offset by the cybersecurity costs and lower operating income in the Global Consumer Solutions business. There were also several income tax benefits, consisting principally of the fourth quarter tax benefit related to the Tax Act and the prospective adoption of the new stock-based compensation guidance in the first quarter of 2017. Additionally there was an increase in other income, primarily due to a 2016 loss on economic hedges, offset by a foreign currency gain on intercompany debt, both items related to the Veda transaction which did not recur in 2017.
Consolidated net income increased by $60.3 million, or 14%, in 2016 compared to 2015 due to increased operating income in our USIS and Workforce Solutions businesses. This increase was partially offset by declines due to foreign exchange rates that impacted the International operating segment, the increase in interest expense, as well as increased corporate expenses as described below.
Segment Financial Results
U.S. Information Solutions
|
| | | | | | | | | | | | | | | | | | | | | | | | | | |
| | Twelve Months Ended December 31, | | Change |
U.S. Information Solutions | | | | | | | | 2017 vs. 2016 | | 2016 vs. 2015 |
| 2017 | | 2016 | | 2015 | | $ | | % | | $ | | % |
| | (In millions) |
Operating revenue: | | |
| | |
| | |
| | |
| | |
| | |
| | |
|
Online Information Solutions | | $ | 889.6 |
| | $ | 879.3 |
| | $ | 842.1 |
| | $ | 10.3 |
| | 1 | % | | $ | 37.2 |
| | 4 | % |
Mortgage Solutions | | 148.9 |
| | 142.2 |
| | 124.1 |
| | 6.7 |
| | 5 | % | | 18.1 |
| | 15 | % |
Financial Marketing Services | | 224.2 |
| | 215.0 |
| | 205.1 |
| | 9.2 |
| | 4 | % | | 9.9 |
| | 5 | % |
Total operating revenue | | $ | 1,262.7 |
| | $ | 1,236.5 |
| | $ | 1,171.3 |
| | $ | 26.2 |
| | 2 | % | | $ | 65.2 |
| | 6 | % |
% of consolidated revenue | | 37 | % | | 39 | % | | 44 | % | | |
| | |
| | |
| | |
|
Total operating income | | $ | 539.1 |
| | $ | 537.0 |
| | $ | 491.2 |
| | $ | 2.1 |
| | — | % | | $ | 45.8 |
| | 9 | % |
Operating margin | | 42.7 | % | | 43.4 | % | | 41.9 | % | | |
| | (0.7 | )pts | | |
| | 1.5 | pts |
U.S. Information Solutions revenue increased 2% in 2017 compared to 2016 due to growth in the mortgage and financial verticals, partially offset by a decline in our auto vertical and the impact of the cybersecurity incident.
U.S. Information Solutions revenue increased 6% in 2016 compared to 2015. USIS realized solid growth from our mortgage business, as well as continued revenue growth in the automotive and financial services verticals.
Online Information Solutions. Revenue for 2017 increased 1% compared to 2016, due to growth in core credit decisioning and identity and fraud solutions.
Revenue for 2016 increased 4% compared to 2015, due to higher average revenue per unit and increased volumes to mortgage resellers, auto, and other resellers. Revenue also benefited from growth in identity and fraud solutions.
Mortgage Solutions. Revenue increased 5% in 2017 compared to 2016, driven by growth in core mortgage, as well as growth from other mortgage product offerings.
Revenue increased 15% in 2016 compared to 2015, driven by a strong market for refinancing and purchase activity, as well as growth from other mortgage product offerings.
Financial Marketing Services. Revenue increased 4% in 2017 compared to 2016 due to growth in credit marketing services and project related revenue.
Revenue increased 5% in 2016 compared to 2015 due to growth in credit marketing services, which resulted from increased demand from financial services customers.
U.S. Information Solutions Operating Margin. USIS operating margin decreased to 42.7% in 2017 compared to 2016 of 43.4% , primarily due to increased people costs, partially offset by product mix. USIS operating margin increased to 43.4% in 2016 as compared to 2015 of 41.9%. Margin expansion resulted from strong revenue growth and product mix.
International
|
| | | | | | | | | | | | | | | | | | | | | | | | | | |
| | Twelve Months Ended December 31, | | Change |
| | | | | | | | 2017 vs. 2016 | | 2016 vs. 2015 |
International | | 2017 | | 2016 | | 2015 | | $ | | % | | $ | | % |
| | (In millions) |
Operating revenue: | | | | | | | | | | | | | | |
Asia Pacific | | $ | 308.9 |
| | $ | 244.2 |
| | $ | 9.0 |
| | $ | 64.7 |
| | 26 | % | | $ | 235.2 |
| | nm |
|
Europe | | 273.8 |
| | 253.6 |
| | 237.5 |
| | 20.2 |
| | 8 | % | | 16.1 |
| | 7 | % |
Latin America | | 213.6 |
| | 183.9 |
| | 199.6 |
| | 29.7 |
| | 16 | % | | (15.7 | ) | | (8 | )% |
Canada | | 136.0 |
| | 121.9 |
| | 122.4 |
| | 14.1 |
| | 12 | % | | (0.5 | ) | | — | % |
Total operating revenue | | $ | 932.3 |
| | $ | 803.6 |
| | $ | 568.5 |
| | $ | 128.7 |
| | 16 | % | | $ | 235.1 |
| | 41 | % |
% of consolidated revenue | | 28 | % | | 26 | % | | 21 | % | | | | | | | | |
Total operating income | | $ | 169.4 |
| | $ | 111.4 |
| | $ | 113.5 |
| | $ | 58.0 |
| | 52 | % | | $ | (2.1 | ) | | (2 | )% |
Operating margin | | 18.2 | % | | 13.9 | % | | 20.0 | % | | | | 4.3 | pts | | |
| | (6.1 | )pts |
International revenue increased by 16% in 2017 as compared to 2016. Local currency organic revenue growth for 2017, excluding Veda, was 11%, driven by growth across all regions. Local currency fluctuations against the U.S. dollar negatively impacted revenue by $4.3 million, or 1%.
International revenue increased by 41% in 2016 as compared to 2015. Local currency organic revenue growth for 2016, which excludes Veda, was 12%, primarily driven by strong growth in Europe and Latin America. Local currency fluctuations against the U.S. dollar negatively impacted revenue by $69.8 million, or 12%.
Asia Pacific. Local currency growth was 24% in 2017 primarily due to the Veda acquisition. Local currency fluctuations against the U.S. dollar positively impacted revenue by $6.1 million, or 3%, in 2017. Reported revenue increased 26% in 2017.
Revenue growth of $235.2 million in 2016 was due to the Veda acquisition.
Europe. Local currency revenue growth was 12% in 2017 primarily due to growth in U.K. debt management services and other growth in the U.K. and Spain. Local currency fluctuations against the U.S. dollar negatively impacted revenue by $9.1 million, or 4%, for 2017. Reported revenue increased 8% in 2017.
Local currency revenue growth was 18% in 2016 primarily due to growth in U.K. debt management services and analytical services in both the U.K. and Spain. Local currency fluctuations against the U.S. dollar negatively impacted revenue by $25.9 million, or 11%, for 2016. Reported revenue increased 7% in 2016.
Latin America. Local currency revenue increased 18% in 2017 driven by growth primarily in Argentina and Chile. Local currency fluctuations against the U.S. dollar negatively impacted revenue by $3.9 million, or 2%, in 2017, most notably due to depreciation in the foreign exchange rate of the Argentine peso, partially offset by appreciation of the Chilean peso. Reported revenue increased 16% in 2017.
Local currency revenue increased 12% in 2016 driven by core organic growth primarily in Argentina, Chile, and Paraguay. Local currency fluctuations against the U.S. dollar negatively impacted revenue by $39.5 million, or 20%, in 2016, most notably due to depreciation in the foreign exchange rate of the Argentine peso. Reported revenue decreased 8% in 2016.
Canada. Local currency revenue increased 9% in 2017 compared to 2016, primarily due to organic growth. Local currency fluctuations against the U.S. dollar negatively impacted revenue by $2.7 million, or 2%, in 2017. Reported revenue increased 12% in 2017.
Local currency revenue increased 3% in 2016 compared to 2015, primarily due to core organic growth. Local currency fluctuations against the U.S. dollar negatively impacted revenue by $4.4 million, or 4%, in 2016. Reported revenue was flat in 2016.
International Operating Margin. Operating margin increased to 18.2% in 2017 as compared to 13.9% in 2016. The increase primarily resulted from a decrease in integration costs related to the Veda acquisition, lower growth in people costs, a gain on the sale of an asset, and a slight decrease in purchased intangibles amortization. Operating margin decreased to 13.9% in 2016 as compared to 20.0% in 2015. The decline primarily resulted from increased purchased intangibles amortization, integration costs related to the Veda acquisition and a decline in the margin of Latin America. The decline was partially offset by increased margins in Europe and Canada.
Workforce Solutions
|
| | | | | | | | | | | | | | | | | | | | | | | | | | |
| | Twelve Months Ended December 31, | | Change |
| | | | | | | | 2017 vs. 2016 | | 2016 vs. 2015 |
Workforce Solutions | | 2017 | | 2016 | | 2015 | | $ | | % | | $ | | % |
| | (In millions) |
Operating Revenue: | | |
| | |
| | |
| | |
| | |
| | |
| | |
|
Verification Services | | $ | 501.5 |
| | $ | 437.3 |
| | $ | 364.4 |
| | $ | 64.2 |
| | 15 | % | | $ | 72.9 |
| | 20 | % |
Employer Services | | 262.7 |
| | 264.9 |
| | 213.3 |
| | (2.2 | ) | | (1 | )% | | 51.6 |
| | 24 | % |
Total operating revenue | | $ | 764.2 |
| | $ | 702.2 |
| | $ | 577.7 |
| | $ | 62.0 |
| | 9 | % | | $ | 124.5 |
| | 22 | % |
% of consolidated revenue | | 23 | % | | 22 | % | | 22 | % | | |
| | |
| | |
| | |
|
Total operating income | | $ | 331.9 |
| | $ | 295.5 |
| | $ | 218.8 |
| | $ | 36.4 |
| | 12 | % | | $ | 76.7 |
| | 35 | % |
Operating margin | | 43.4 | % | | 42.1 | % | | 37.9 | % | | |
| | 1.3 | pts | | |
| | 4.2 | pts |
Workforce Solutions revenue increased by 9% in 2017 compared to 2016 due to strong growth in the government, mortgage, financial and pre-employment screening verticals, partially offset by the impact of the cybersecurity incident.
Workforce Solutions revenue increased by 22% in 2016 compared to 2015 due to strong growth in the healthcare, mortgage, government, and financial verticals.
Verification Services. Revenue increased 15% in 2017 compared to 2016, due to strong growth in government, mortgage, financial, pre-employment screening and telecommunications verticals, and continued addition of new records to The Work Number database.
Revenue increased 20% in 2016 compared to 2015, due to strong growth in mortgage, government, financial, pre-employment screening and auto verticals, and continued addition of new records to The Work Number database.
Employer Services. Revenue decreased 1% in 2017 compared to 2016 due to a decline in our employment based tax credit services and workforce analytics offset by an increase in our on-boarding and unemployment claims services.
Revenue grew 24% in 2016 compared to 2015 due to growth in our workforce analytics and other employer services businesses.
Workforce Solutions Operating Margin. Operating margin increased 130 basis points to 43.4% in 2017 as compared to 42.1% in 2016 due to revenue growth and product mix, offset by increased people costs. Operating margin increased 420 basis points to 42.1% in 2016 as compared to 37.9% in 2015. Margin expansion in 2016 was driven by strong revenue growth in 2016.
Global Consumer Solutions
|
| | | | | | | | | | | | | | | | | | | | | | | | | | |
| | Twelve Months Ended December 31, | | Change |
Global Consumer Solutions | | | | | | | | 2017 vs. 2016 | | 2016 vs. 2015 |
| 2017 | | 2016 | | 2015 | | $ | | % | | $ | | % |
| | (In millions) |
Total operating revenue | | $ | 403.0 |
| | $ | 402.6 |
| | $ | 346.1 |
| | $ | 0.4 |
| | — | % | | $ | 56.5 |
| | 16 | % |
% of consolidated revenue | | 12 | % | | 13 | % | | 13 | % | | | | | | | | |
Total operating income | | $ | 106.2 |
| | $ | 112.4 |
| | $ | 95.2 |
| | $ | (6.2 | ) | | (6 | )% | | $ | 17.2 |
| | 18 | % |
Operating margin | | 26.4 | % | | 27.9 | % | | 27.5 | % | | | | (1.5 | )pts | | |
| | 0.4 | pts |
Revenue was flat for 2017, as compared to prior year. Local currency revenue grew 1% in 2017, due to an increase in our partner revenue, which includes revenue from the ID Watchdog acquisition. The increase in revenue was offset by a decrease in our global consumer direct revenue which was primarily in the U.S. as we ceased advertising our consumer business in the U.S. in September 2017 following the cybersecurity incident. Local currency fluctuations against the U.S. dollar negatively impacted revenue by $1.8 million for 2017. We do not intend to advertise our U.S. paid products in the first half of 2018 and expect a corresponding decline in revenue for 2018. Operating margin decreased in 2017 to 26.4% as compared to 27.9% in the prior year, due to higher technology costs, product mix, higher depreciation and acquisition costs, partially offset by lower marketing expenses.
Revenue increased 16% for 2016, as compared to prior year. Local currency revenue grew 18% in 2016, principally due to the growth of direct to consumer reseller revenue, and to a lesser extent, due to consumer direct revenue growth globally. Local currency fluctuations against the U.S. dollar negatively impacted revenue by $5.4 million, or 2%, for 2016. Operating margin increased in 2016 to 27.9% as compared to 27.5% in the prior year, due to lower marketing expenses partially offset by higher production costs due to reseller product mix and increases in partner implementation costs
General Corporate Expense
|
| | | | | | | | | | | | | | | | | | | | | | | | | | |
| | Twelve Months Ended December 31, | | Change |
| | | | | | | | 2017 vs. 2016 | | 2016 vs. 2015 |
General Corporate Expense | | 2017 | | 2016 | | 2015 | | $ | | % | | $ | | % |
| | (In millions) |
General corporate expense | | $ | 322.0 |
| | $ | 238.4 |
| | $ | 224.8 |
| | $ | 83.6 |
| | 35 | % | | $ | 13.6 |
| | 6 | % |
Our general corporate expenses are unallocated costs that are incurred at the corporate level and include those expenses impacted by corporate direction, including shared services, technology, administrative, legal, restructuring, and the portion of management incentive compensation determined by total company-wide performance. General corporate expense increased $83.6 million in 2017 primarily due to costs related to the cybersecurity incident.
General corporate expense increased $13.6 million in 2016 due to Veda transaction and integration costs as well as other increases in people costs, offset by a decline in costs related to the realignment of internal resources.
LIQUIDITY AND FINANCIAL CONDITION
Management assesses liquidity in terms of our ability to generate cash to fund operating, investing and financing activities. We continue to generate substantial cash from operating activities and remain in a strong financial position managing our capital structure to meet short- and long-term objectives including reinvestment in existing businesses and strategic acquisitions.
Sources and Uses of Cash
Funds generated by operating activities and our commercial paper program, credit facilities and Receivables Facility are our most significant sources of liquidity. We expect that funds generated by operating activities will be sufficient to finance our anticipated working capital and other cash requirements (such as ongoing capital expenditures associated with near-term actions to enhance IT systems and data security, interest payments, debt payments, potential pension funding contributions and dividend payments) for the foreseeable future. However, currently it is not possible to estimate the amount of loss or range of possible loss that might result from adverse judgments, settlements, penalties, or other resolution of the proceedings and investigations resulting from the 2017 cybersecurity incident. Such potential payments, if great enough, could have an adverse effect on our liquidity. In this case, funds generated from operating activities and our credit facilities may not be sufficient to pay such damages, costs, penalties and fines. See Part I, Item 1A. Risk Factors "The government investigations and litigation resulting from the 2017 cybersecurity incident will continue to adversely impact our business and results of operations" and Part I, Item 3. Legal Proceedings. At December 31, 2017, $221.9 million was available to borrow under our Revolver. As of December 31, 2017, $204.3 million was available to borrow under our Receivables Facility. In the event that additional financing is needed, we would finance using the public and private corporate bond markets and/or syndicated loan markets.
Information about our cash flows, by category, is presented in the Consolidated Statements of Cash Flows. The following table summarizes our cash flows for the twelve months ended December 31, 2017, 2016 and 2015:
|
| | | | | | | | | | | | | | | | | | | | |
| | Twelve Months Ended December 31, | | Change |
Net cash provided by (used in): | | 2017 | | 2016 | | 2015 | | 2017 vs. 2016 | | 2016 vs. 2015 |
| | (In millions) |
Operating activities | | $ | 816.0 |
|
| $ | 823.0 |
|
| $ | 769.1 |
| | $ | (7.0 | ) | | $ | 53.9 |
|
Investing activities | | $ | (349.5 | ) |
| $ | (1,975.9 | ) |
| $ | (147.8 | ) | | $ | 1,626.4 |
| | $ | (1,828.1 | ) |
Financing activities | | $ | (263.7 | ) |
| $ | 1,160.3 |
|
| $ | (639.0 | ) | | $ | (1,424.0 | ) | | $ | 1,799.3 |
|
Operating Activities
Cash provided by operating activities for 2017 decreased by $7.0 million compared to 2016, due to an increase in working capital mostly driven by an increase in other assets, current and long-term and slower growth in current and long-term liabilities, excluding debt. Additionally we incurred significant costs related to the cybersecurity incident. These decreases were partially offset by growth in net income, slower growth in accounts receivable, net and an increase in depreciation and amortization.
Cash provided by operating activities for 2016 increased by $53.9 million compared to 2015, due to $60.3 million growth in net income, partially offset by an increase in working capital mostly driven by an increase in accounts receivable, lower growth in other liabilities, current and long-term, excluding debt.
Fund Transfer Limitations. The ability of certain of our subsidiaries and associated companies to transfer funds to us may be limited, in some cases, by certain restrictions imposed by foreign governments. These restrictions do not, individually or in the aggregate, materially limit our ability to service our indebtedness, meet our current obligations or pay dividends. We currently hold $141.7 million of cash in our foreign subsidiaries.
Investing Activities
|
| | | | | | | | | | | | | | | | | | | | |
| | Twelve Months Ended December 31, | | Change |
Net cash used in: | | 2017 | | 2016 | | 2015 | | 2017 vs. 2016 | | 2016 vs. 2015 |
| | (In millions) |
Capital expenditures* | | $ | (218.2 | ) | | $ | (173.5 | ) | | $ | (146.2 | ) | | $ | (44.7 | ) | | $ | (27.3 | ) |
*Amounts above are total cash outflows for capital expenditures.
Our capital expenditures are used for developing, enhancing and deploying new and existing software in support of our expanding product set, replacing or adding equipment, updating systems for regulatory compliance, licensing of standard software applications, investing in system reliability, security and disaster recovery enhancements, and updating or expanding our office facilities.
Capital expenditures in 2017 and 2016 increased from 2016 and 2015, respectively, as we are continuing to invest in new products and technology infrastructure.
Acquisitions, Divestitures and Investments
|
| | | | | | | | | | | | | | | | | | | | |
| | Twelve Months Ended December 31, | | Change |
Net cash provided by (used in): | | 2017 | | 2016 | | 2015 | | 2017 vs. 2016 | | 2016 vs. 2015 |
| | (In millions) |
Acquisitions, net of cash acquired | | $ | (139.9 | ) | | $ | (1,791.6 | ) | | $ | (4.4 | ) | | $ | 1,651.7 |
| | $ | (1,787.2 | ) |
Cash received from sale of asset | | $ | 8.6 |
| | $ | — |
| | $ | — |
| | $ | 8.6 |
| | $ | — |
|
Cash paid to settle economic hedges | | $ | — |
| | $ | (10.8 | ) | | $ | — |
| | $ | 10.8 |
| | $ | (10.8 | ) |
Cash received from divestitures | | $ | — |
| | $ | — |
| | $ | 2.9 |
| | $ | — |
| | $ | (2.9 | ) |
Investment in unconsolidated affiliates, net | | $ | — |
| | $ | — |
| | $ | (0.1 | ) | | $ | — |
| | $ | 0.1 |
|
2017 Acquisitions and Investments. During the fourth quarter of 2017, we acquired 100% of the outstanding stock of Mercury Group of Companies Pty Ltd ("Mercury"), an Australian-owned workforce management company. During the third quarter of 2017, we completed the acquisition of 100% of the outstanding stock of ID Watchdog, Inc.
2016 Acquisitions and Investments. During the first quarter of 2016, the Company completed the acquisition of 100% of the ordinary voting shares of Veda for cash consideration of approximately $1.7 billion. During the first quarter of 2016, we settled all of the foreign currency options related to the Veda acquisition on the respective settlement dates for a net cash payment of $10.8 million. During the third quarter of 2016, the Company completed the acquisition of Barnett and Computersoft. Refer to Note 3 for more information on these acquisitions.
2015 Acquisitions and Investments. During the first quarter of 2015, we acquired a 75% equity interest investment in a debt collections and recovery management venture in the U.K., as more fully described in Note 1. During the third quarter of 2015, we received $2.9 million proceeds from the escrow related to a past disposition. We did not make significant investments in unconsolidated affiliates during 2015.
For additional information about our acquisitions, see Note 3 of the Notes to Consolidated Financial Statements in this report.
Financing Activities
|
| | | | | | | | | | | | | | | | | | | | |
| | Twelve Months Ended December 31, | | Change |
Net cash provided by (used in): | | 2017 | | 2016 | | 2015 | | 2017 vs. 2016 | | 2016 vs. 2015 |
| | (In millions) |
Net short-term borrowings (repayments) | | $ | 252.4 |
| | $ | 73.0 |
| | $ | (331.0 | ) | | $ | 179.4 |
| | $ | 404.0 |
|
Proceeds from issuance of long-term debt | | $ | 100.0 |
| | $ | 1,574.7 |
| | $ | — |
| | $ | (1,474.7 | ) | | $ | 1,574.7 |
|
Payments on long-term debt | | $ | (322.5 | ) | | $ | (350.0 | ) | | $ | — |
| | $ | 27.5 |
| | $ | (350.0 | ) |
Payment of contingent consideration | | $ | (3.5 | ) | | $ | (4.4 | ) | | $ | — |
| | $ | 0.9 |
| | $ | (4.4 | ) |
Debt issuance costs | | $ | (0.3 | ) | | $ | (6.2 | ) | | $ | (4.9 | ) | | $ | 5.9 |
| | $ | (1.3 | ) |
Credit Facility Availability. Our principal unsecured revolving credit facility with a group of banks, which we refer to as the Revolver, permits us to borrow up to $900.0 million through November 2020. The Revolver may be used for general corporate purposes. Availability of the Revolver for borrowings is reduced by the outstanding face amount of any letters of credit issued under the facility and, pursuant to our existing Board of Directors authorization, by the outstanding principal amount of our commercial paper (CP) notes. As a condition to borrow under our Revolver, we are required to certify certain representations and warranties (as defined in the Revolver). We believe we are currently in compliance with all such
representations and warranties necessary as a condition for borrowing under the Revolver, but we cannot assure that we will be able to comply with all such conditions to borrowing in the future. On October 12, 2017, we borrowed $100 million on our Revolver.
Our $900.0 million CP program has been established to allow for borrowing through the private placement of CP with maturities ranging from overnight to 397 days. We may use the proceeds of CP for general corporate purposes. The CP program is supported by our Revolver and the total amount of CP which may be issued is reduced by the amount of any outstanding borrowings under our Revolver.
At December 31, 2017, the Company had $562.6 million of CP, $15.5 million of letters of credit outstanding and $100.0 million borrowings outstanding under the Revolver. At December 31, 2017, a total of $221.9 million was available under the Revolver.
At December 31, 2017, approximately 61% of our debt was fixed rate and 39% was effectively variable rate. Our variable-rate debt consists of our issued commercial paper, the Revolver and Term Loan, which bears short-term interest rates based on the CP market for investment grade issuers. The interest rates reset periodically, depending on the terms of the respective financing arrangements. At December 31, 2017, interest rates on our variable-rate debt ranged from 1.6% to 2.7%.
Borrowing and Repayment Activity. Net short-term borrowings (repayments) primarily represent borrowings or repayments of outstanding amounts under our CP program. We primarily borrow under our CP program, as needed and availability allows.
The increase in net short-term borrowings (repayments) primarily relates to the net activity of CP notes in 2017. The increase in net short-term borrowings (repayments) in 2016 primarily relates to the net activity of CP notes, as well as the draw down on the 364-Day Revolver during the second quarter of 2016.
On May 12, 2016, we issued $500.0 million principal amount of 2.3%, five-year senior notes and $275.0 million principal amount of 3.25%, ten-year senior notes in an underwritten public offering. Interest is payable semi-annually in arrears on June 1 and December 1 of each year, beginning on December 1, 2016. The net proceeds of the sale of the notes were used to repay borrowings under our 364-Day Revolver and a portion of the borrowings under our commercial paper program incurred to finance the acquisition of Veda. We must comply with various non-financial covenants, including certain limitations on mortgages, liens and sale-leaseback transactions, as well as mergers and sales of substantially all of our assets. The senior notes are unsecured and rank equally with all of our other unsecured and unsubordinated indebtedness.
Payments on long-term debt in 2017 reflect $272.5 million of payments related to senior notes, as well as $50.0 million of payments on the Term Loan. Borrowings on long-term debt reflect an $800.0 million draw down in the first quarter of 2016 on our Term Loan Facility and the issuance of $500.0 million of senior notes due 2021 and $275.0 million of senior notes due 2026 during the second quarter of 2016, as discussed above.
The decrease in payments on long-term debt in 2015 reflects the 2014 pay-off of our $15.0 million 7.34% Notes and $275.0 million 4.45% Senior Notes with borrowings under our CP program.
The debt issuance costs in 2016 and 2015 reflect the debt issuance costs paid in connection with the new Senior Credit Facilities entered into in May 2016 and November 2015, respectively.
In the fourth quarter of 2017, Equifax entered into a $225 million, 2-year receivables funding facility (the Receivables Facility), which matures in 2019. Under the Receivables Facility, Equifax sells the eligible third-party receivables of its U.S. based business, to Equifax Receivables Funding LLC, a consolidated, wholly-owned, bankruptcy-remote subsidiary that may subsequently transfer, without recourse, an undivided interest in accounts receivable to investors. The investors have no recourse to the Company’s other assets except for customary warranty and indemnity claims. Creditors of Equifax do not have recourse to the assets of Equifax Receivables Funding LLC. As a condition to borrow under the Receivables Facility, we are required to certify certain representations and warranties. We believe we are currently in compliance with all such representations and warranties necessary as a condition for borrowing under the Receivables Facility, but we cannot assure that we will be able to comply with all such conditions to borrowing in the future.
Debt Covenants. A downgrade in credit ratings would increase the cost of borrowings under our CP program and Senior Credit Facilities, and could limit or, in the case of a significant downgrade, preclude our ability to issue CP. The outstanding indentures and comparable instruments contain customary covenants including, for example, limits on mortgages, liens and sale/leaseback transactions. In addition, the Senior Credit Facilities require us to maintain a maximum leverage ratio
of not more than 3.5 to 1.0. As permitted under the terms of the Senior Credit Facilities, we made the election to increase the covenant to 4.0 to 1.0, effective for four consecutive quarters, beginning with the first quarter of 2016 and continuing through the fourth quarter of 2016. None of these covenants are considered restrictive to our operations and, as of December 31, 2017, the Company was in compliance with all of our debt covenants.
The Company does not have any credit rating triggers that would accelerate the maturity of a material amount of the outstanding debt; however, the 2.3% senior notes due 2021, 3.3% senior notes due 2022, 3.25% senior notes due 2026 and 7.0% senior notes due 2037 (together, the “Senior Notes”) contain change in control provisions. If the Company experiences a change of control or publicly announces the Company's intention to effect a change of control and the rating on the senior notes is lowered by Standard & Poor’s, or S&P, and Moody’s Investors Service, or Moody’s, below an investment grade rating within 60 days of such change of control or notice thereof, then the Company will be required to offer to repurchase the senior notes at a price equal to 101% of the aggregate principal amount of the senior notes plus accrued and unpaid interest.
Credit Ratings. Credit ratings reflect an independent agency’s judgment on the likelihood that a borrower will repay a debt obligation at maturity. The ratings reflect many considerations, such as the nature of the borrower’s industry and its competitive position, the size of the company, its liquidity and access to capital and the sensitivity of a company’s cash flows to changes in the economy. The two largest rating agencies, S&P and Moody’s, use alphanumeric codes to designate their ratings. The highest quality rating for long-term credit obligations is AAA and Aaa for S&P and Moody’s, respectively. A security rating is not a recommendation to buy, sell or hold securities and may be subject to revision or withdrawal at any time by the assigning rating agency.
Long-term ratings of BBB- and Baa3 or better by S&P and Moody’s, respectively, reflect ratings on debt obligations that fall within a band of credit quality considered to be “investment grade.” At December 31, 2017, the long-term ratings for our obligations were BBB+ with a negative outlook for S&P and Baa1 with a stable outlook for Moody's. A downgrade in our credit rating would increase the cost of borrowings under our CP program and credit facilities, and could limit, or in the case of a significant downgrade, preclude our ability to issue CP. If our credit ratings were to decline to lower levels, we could experience increases in the interest cost for any new debt. In addition, the market’s demand for, and thus our ability to readily issue, new debt could become further affected by the economic and credit market environment. These ratings are subject to change as events and circumstances change.
For additional information about our debt, including the terms of our financing arrangements, basis for variable interest rates and debt covenants, see Note 5 of the Notes to Consolidated Financial Statements in this report.
Equity Transactions
|
| | | | | | | | | | | | | | | | | | | | |
| | Twelve Months Ended December 31, | | Change |
Net cash provided by (used in): | | 2017 | | 2016 | | 2015 | | 2017 vs. 2016 | | 2016 vs. 2015 |
| | (In millions) |
Treasury stock purchases | | $ | (77.1 | ) | | $ | — |
| | $ | (196.3 | ) | | $ | (77.1 | ) | | $ | 196.3 |
|
Dividends paid to Equifax shareholders | | $ | (187.4 | ) | | $ | (157.6 | ) | | $ | (137.8 | ) | | $ | (29.8 | ) | | $ | (19.8 | ) |
Dividends paid to noncontrolling interests | | $ | (8.4 | ) | | $ | (5.8 | ) | | $ | (6.4 | ) | | $ | (2.6 | ) | | $ | 0.6 |
|
Proceeds from exercise of stock options | | $ | 19.2 |
| | $ | 31.5 |
| | $ | 34.4 |
| | $ | (12.3 | ) | | $ | (2.9 | ) |
Excess tax benefits from stock-based compensation plans | | $ | — |
| | $ | 35.9 |
| | $ | 30.0 |
| | $ | (35.9 | ) | | $ | 5.9 |
|
Purchase of redeemable noncontrolling interests | | $ | (2.6 | ) | | $ | (3.6 | ) | | $ | — |
| | $ | 1.0 |
| | $ | (3.6 | ) |
Sources and uses of cash related to equity during the twelve months ended December 31, 2017, 2016 and 2015 were as follows:
| |
• | Under share repurchase programs authorized by our Board of Directors, we repurchased 0.5 million and 2.1 million common shares during the twelve months ended December 31, 2017 and 2015, respectively, for $77.1 million and $196.3 million, respectively, at an average price per common share of $143.88 and $94.97, respectively. We did not repurchase any shares in 2016. As of December 31, 2017, under the existing board authorization, the Company is approved for additional stock repurchases valued at $590.1 million. |
| |
• | During the twelve months ended December 31, 2017, 2016 and 2015, we paid cash dividends to Equifax shareholders of $187.4 million, $157.6 million and $137.8 million, respectively, at $1.56 per share for 2017, $1.32 per share for 2016 and $1.16 per share for 2015. |
We anticipate continuing the payment of quarterly cash dividends. The actual amount of such dividends is subject to declaration by our Board of Directors and will depend upon future earnings, results of operations, capital requirements, our financial condition and other relevant factors. There can be no assurance that the Company will continue to pay quarterly cash dividends at current levels or at all.
Contractual Obligations and Commercial Commitments
The following table summarizes our significant contractual obligations and commitments as of December 31, 2017. The table excludes commitments that are contingent based on events or factors uncertain at this time. Some of the excluded commitments are discussed below the footnotes to the table.
|
| | | | | | | | | | | | | | | | | | | |
| Payments due by |
| Total | | Less than 1 year | | 1 to 3 years | | 3 to 5 years | | Thereafter |
| (In millions) |
Debt (including capitalized lease obligation) (1) | $ | 2,715.3 |
| | $ | 965.3 |
| | $ | 100.0 |
| | $ | 1,000.0 |
| | $ | 650.0 |
|
Operating leases (2) | 150.0 |
| | 27.3 |
| | 38.9 |
| | 28.6 |
| | 55.2 |
|
Data processing, outsourcing agreements and other purchase obligations (3) | 157.1 |
| | 85.4 |
| | 41.3 |
| | 14.0 |
| | 16.4 |
|
Other long-term liabilities (4) (5) | 143.2 |
| | 9.1 |
| | 18.1 |
| | 18.9 |
| | 97.1 |
|
Product liability related to cybersecurity incident (6) | 27.1 |
| | 27.1 |
| | — |
| | — |
| | — |
|
Interest payments (7) | 647.3 |
| | 75.4 |
| | 131.2 |
| | 108.9 |
| | 331.8 |
|
| $ | 3,840.0 |
| | $ | 1,189.6 |
| | $ | 329.5 |
| | $ | 1,170.4 |
| | $ | 1,150.5 |
|
| |
(1) | The amounts are gross of unamortized discounts totaling $11.0 million at December 31, 2017. Total debt on our Consolidated Balance Sheets is net of the unamortized discounts and fair value adjustments. There were no fair value adjustments to our debt at December 31, 2017. |
| |
(2) | Our operating lease obligations principally involve office space and equipment, which include the ground lease associated with our headquarters building that expires in 2048. |
| |
(3) | These agreements primarily represent our minimum contractual obligations for services that we outsource associated with our computer data processing operations and related functions, and certain administrative functions. These agreements expire between 2018 and 2022. |
| |
(4) | These long-term liabilities primarily relate to obligations associated with certain pension, postretirement and other compensation-related plans, some of which are discounted in accordance with U.S. generally accepted accounting principles, or GAAP. We made certain assumptions about the timing of such future payments. In the table above, we have not included amounts related to future pension plan obligations, as such required funding amounts beyond 2018 have not been deemed necessary due to our current expectations regarding future plan asset performance. |
| |
(5) | This table excludes $38.0 million of unrecognized tax benefits, including interest and penalties, as we cannot make a reasonably reliable estimate of the period of cash settlement with the respective taxing authorities. |
| |
(6) | As a result of the cybersecurity incident, we offered free credit file monitoring and identity theft protection to all U.S. consumers. We have recorded the expenses necessary to provide this service to those who signed up by the January 31, 2018 deadline. The amount above represents the remaining obligation associated with these expenses. |
| |
(7) | For future interest payments on variable-rate debt, which are generally based on a specified margin plus a base rate (LIBOR) or on CP, the Revolver and Term Loan rates for investment grade issuers, we used the variable rate in effect at December 31, 2017 to calculate these payments. Our variable rate debt at December 31, 2017, consisted of CP, the |
Revolver and Term Loan. Future interest payments related to our Senior Credit Facilities and our CP program are based on the borrowings outstanding at December 31, 2017 through their respective maturity dates, assuming such borrowings are outstanding until that time. The variable portion of the rate at December 31, 2017 ranged from 1.6% to 2.7% for all of our variable-rate debt. Future interest payments may be different depending on future borrowing activity and interest rates.
Off-Balance Sheet Transactions
We do not engage in off-balance sheet financing activities.
Pursuant to the terms of certain industrial revenue bonds, we have transferred title to certain of our fixed assets with total costs of $156.4 million and $117.0 million, as of December 31, 2017 and 2016, respectively, to a local governmental authority in the U.S. to receive a property tax abatement related to economic development. The title to these assets will revert back to us upon retirement or cancellation of the applicable bonds. These fixed assets are still recognized on the Company’s Consolidated Balance Sheets as all risks and rewards remain with the Company.
Letters of Credit and Guarantees
We will from time to time issue standby letters of credit, performance bonds or other guarantees in the normal course of business. The aggregate notional amount of all performance bonds and standby letters of credit was not material at December 31, 2017, and all have a remaining maturity of one year or less. Guarantees are issued from time to time to support the needs of our operating units. The maximum potential future payments we could be required to make under the guarantees is not material at December 31, 2017.
Benefit Plans
We sponsor a qualified defined benefit retirement plan (the U.S. Retirement Income Plan, or USRIP) that covers approximately 15% of current U.S. salaried employees who were hired on or before June 30, 2007, the last date on which an individual could be hired and enter the plan before the USRIP was frozen to new participation at December 31, 2008. This plan also covers many retirees as well as certain terminated but vested individuals not yet in retirement status. We also sponsor a defined benefit plan that covers most salaried and hourly employees in Canada (the Canadian Retirement Income Plan, or CRIP). The CRIP was frozen to new participants entering the plan on or after October 1, 2011.
At December 31, 2017, the USRIP met or exceeded ERISA’s minimum funding requirements. During the twelve months ended December 31, 2017 and 2016, we did not make any contributions to the USRIP. We contributed $1.5 million and $0.8 million to the CRIP during the twelve months ended December 31, 2017 and 2016, respectively. In the future, we will make minimum funding contributions as required and may make discretionary contributions, depending on certain circumstances, including market conditions and liquidity needs. We believe additional funding contributions, if any, would not prevent us from continuing to meet our liquidity needs, which are primarily funded from cash flows generated by operating activities, available cash and cash equivalents, and our credit facilities.
For our non-U.S., tax-qualified retirement plans, we fund an amount sufficient to meet minimum funding requirements but no more than allowed as a tax deduction pursuant to applicable tax regulations. For the non-qualified supplementary retirement plans, we fund the benefits as they are paid to retired participants, but accrue the associated expense and liabilities in accordance with GAAP.
For additional information about our benefit plans, see Note 10 of the Notes to Consolidated Financial Statements in this report.
Effects of Inflation and Changes in Foreign Currency Exchange Rates
Equifax’s operating results are not materially affected by inflation, although inflation may result in increases in the Company’s expenses, which may not be readily recoverable in the price of services offered. To the extent inflation results in rising interest rates and has other adverse effects upon the securities markets and upon the value of financial instruments, it may adversely affect the Company’s financial position and profitability.
A portion of the Company’s business is conducted in currencies other than the U.S. dollar and changes in foreign exchange rates relative to the U.S. dollar can therefore affect the value of non-U.S. dollar net assets, revenues and expenses. Potential exposures as a result of these fluctuations in currencies are closely monitored. We generally do not mitigate the risks
associated with fluctuating exchange rates, although we may from time to time through forward contracts or other derivative instruments hedge a portion of our translational foreign currency exposure or exchange rate risks associated with material transactions which are denominated in a foreign currency.
RECENT ACCOUNTING PRONOUNCEMENTS
For information about new accounting pronouncements and the potential impact on our Consolidated Financial Statements, see Note 1 of the Notes to Consolidated Financial Statements in this report.
APPLICATION OF CRITICAL ACCOUNTING POLICIES AND ESTIMATES
The Company’s Consolidated Financial Statements are prepared in conformity with U.S. generally accepted accounting principles, or GAAP. This requires our management to make estimates and assumptions that affect the reported amounts of assets and liabilities, revenues and expenses and related disclosures of contingent assets and liabilities in our Consolidated Financial Statements and the Notes to Consolidated Financial Statements. The following accounting policies involve critical accounting estimates because they are particularly dependent on estimates and assumptions made by management about matters that are uncertain at the time the accounting estimates are made. In addition, while we have used our best estimates based on facts and circumstances available to us at the time, different estimates reasonably could have been used in the current period, or changes in the accounting estimates that we used are reasonably likely to occur from period to period, either of which may have a material impact on the presentation of our Consolidated Balance Sheets and Statements of Income. We also have other significant accounting policies which involve the use of estimates, judgments and assumptions that are relevant to understanding our results. For additional information about these policies, see Note 1 of the Notes to Consolidated Financial Statements in this report. Although we believe that our estimates, assumptions and judgments are reasonable, they are based upon information available at the time. Actual results may differ significantly from these estimates under different assumptions, judgments or conditions.
Revenue Recognition
Revenue is recognized when persuasive evidence of an arrangement exists, collectibility of arrangement consideration is reasonably assured, the arrangement fees are fixed or determinable and delivery of the product or service has been completed. A significant portion of our revenue is derived from the provision of information services to our customers on a transaction basis, in which case revenue is recognized, assuming all other revenue recognition criteria are met, when the services are provided. A smaller portion of our revenues relate to subscription-based contracts under which a customer pays a preset fee for a predetermined or unlimited number of transactions or services provided during the subscription period, generally one year. Revenue related to subscription-based contracts having a preset number of transactions is recognized as the services are provided, using an effective transaction rate as the actual transactions are completed. Any remaining revenue related to unfulfilled units is not recognized until the end of the related contract’s subscription period. Revenue related to subscription-based contracts having an unlimited volume is recognized ratably during the contract term. Revenue is recorded net of sales taxes.
If at the outset of an arrangement, we determine that collectibility is not reasonably assured, revenue is deferred until the earlier of when collectibility becomes probable or the receipt of payment. If there is uncertainty as to the customer’s acceptance of our deliverables, revenue is not recognized until the earlier of receipt of customer acceptance or expiration of the acceptance period. If at the outset of an arrangement, we determine that the arrangement fee is not fixed or determinable, revenue is deferred until the arrangement fee becomes fixed or determinable, assuming all other revenue recognition criteria have been met.
The determination of certain of our tax management services revenue requires the use of estimates, principally related to transaction volumes in instances where these volumes are reported to us by our clients on a monthly basis in arrears. In these instances, we estimate transaction volumes based on average actual volumes reported in the past. Differences between our estimates and actual final volumes reported are recorded in the period in which actual volumes are reported. We have not experienced significant variances between our estimates and actual reported volumes in the past. We monitor actual volumes to ensure that we will continue to make reasonable estimates in the future. If we determine that we are unable to make reasonable future estimates, revenue may be deferred until actual customer data is obtained. Also within our Workforce Solutions operating segment, the fees for certain of our tax credits and incentives revenue are based on a percentage of the credit delivered to our clients. Revenue for these arrangements is recognized based on the achievement of milestones, upon calculation of the credit, or when the credit is utilized by our client, depending on the provisions of the client contract.
We have certain offerings that are sold as multiple element arrangements. The multiple elements may include consumer or commercial information, file updates for certain solutions, services provided by our decisioning technologies personnel, training services, statistical models and other services. To account for each of these elements separately, the delivered elements must have stand-alone value to our customer. If we are unable to unbundle the arrangement into separate units of accounting, we apply one of the accounting policies described above. This may lead to the arrangement consideration being recognized as the final contract element is delivered to our customer or ratably over the contract.
Many of our multiple element arrangements involve the delivery of services generated by a combination of services provided by one or more of our operating segments. No individual information service impacts the value or usage of other information services included in an arrangement and each service can be sold alone or, in most cases, purchased from another vendor without affecting the quality of use or value to the customer of the other information services included in the arrangement. Some of our products require the development of interfaces or platforms by our decisioning technologies personnel that allow our customers to interact with our proprietary information databases. These development services do not meet the requirement for having stand-alone value, thus any related development fees are deferred when billed and are recognized over the expected period that the customer will benefit from the related decisioning technologies service. Revenue from the provision of statistical models is recognized as the service is provided and accepted, assuming all other revenue recognition criteria are met. The direct costs of set up of a customer are capitalized and amortized as a cost of service during the term of the related customer contract.
We have some multiple element arrangements that include software. We recognize the elements for which we have established vendor specific objective evidence at fair value upon delivery, in accordance with the applicable guidance.
We record revenue on a net basis for those sales in which we have in substance acted as an agent or broker in the transaction.
The debt collections and recovery management revenue is calculated as a percentage of debt collected on behalf of the customer and, as such, is primarily recognized when the cash is collected assuming all other revenue recognition criteria are met.
Deferred revenue consists of amounts billed and collected in excess of revenue recognized on sales relating generally to the deferral of subscription fees and arrangement consideration from elements not meeting the criteria for having stand-alone value discussed above. Deferred revenues are subsequently recognized as revenue in accordance with our revenue recognition policies.
Judgments and uncertainties — Each element of a multiple element arrangement must be considered separately to ensure that appropriate accounting is performed for these deliverables. These considerations include assessing the price at which the element is sold compared to its relative fair value; concluding when the element will be delivered; evaluating collectibility; and determining whether any contingencies exist in the related customer contract that impact the prices paid to us for the services.
In addition, as stated above, the determination of certain of our marketing information services and tax management services revenue requires the use of estimates, principally related to transaction volumes in instances where these volumes are reported to us by our clients on a monthly basis in arrears. In these instances, we estimate transaction volumes based on average actual volumes reported in the past. Differences between our estimates and actual final volumes reported are recorded in the period in which actual volumes are reported.
Effects if actual results differ from assumptions — We have not experienced significant variances between our estimates of marketing information services and tax management services revenues reported to us by our customers and actual reported volumes in the past. We monitor actual volumes to ensure that we will continue to make reasonable estimates in the future. If we determine that we are unable to make reasonable future estimates, revenue may be deferred until actual customer data is obtained. However, if actual results are not consistent with our estimates and assumptions, or if our customer arrangements become more complex or include more bundled offerings in the future, we may be required to recognize revenue differently in the future to account for these changes. We do not believe there is a reasonable likelihood that there will be a material change in the future estimates or assumptions we use to recognize revenue.
Goodwill and Indefinite-Lived Intangible Assets
We review goodwill and indefinite lived intangible assets for impairment annually (as of September 30) and whenever events or changes in circumstances indicate the carrying value of an asset may not be recoverable. These events or circumstances could include a significant change in the business climate, legal factors, operating performance or trends, competition, or sale or disposition of a significant portion of a reporting unit. We have eight reporting units comprised of USIS (which includes Online Information Solutions, Mortgage Solutions and Financial Marketing Services), Asia Pacific, Europe, Latin America, Canada, Global Consumer Solutions ("GCS"), Verification Services and Employer Services.
The goodwill balance at December 31, 2017, for our eight reporting units was as follows:
|
| | | |
| December 31, |
| 2017 |
| (In millions) |
Asia Pacific | 1,534.2 |
|
U.S. Information Solutions | 1,071.3 |
|
Europe | 164.1 |
|
Latin America | 236.1 |
|
Canada | 35.0 |
|
Global Consumer Solutions | 191.2 |
|
Verification Services | 772.9 |
|
Employer Services | 179.2 |
|
Total goodwill | $ | 4,184.0 |
|
Valuation Techniques
We performed a quantitative assessment for each of our reporting units to determine whether impairment exists. In determining the fair value of the reporting units we used a combination of the income and market approaches to estimate the reporting unit’s business enterprise value. We engaged a third party specialist to assist in developing these estimates and valuation approaches.
Under the income approach, we calculate the fair value of a reporting unit based on estimated future discounted cash flows which require assumptions about short and long-term revenue growth rates, operating margins for each reporting unit, discount rates, foreign currency exchange rates and estimates of capital charges. The assumptions we use are based on what we believe a hypothetical marketplace participant would use in estimating fair value. Under the market approach, we estimate the fair value based on market multiples of revenue or earnings before income taxes, depreciation and amortization, for benchmark companies. We believe the benchmark companies used for each of the reporting units serve as an appropriate input for calculating a fair value for the reporting unit as those benchmark companies have similar risks, participate in similar markets, provide similar services for their customers and compete with us directly. The companies we use as benchmarks are principally outlined in our discussion of Competition in Item 1 of this Form 10-K. Data for the benchmark companies was obtained from publicly available information.
Competition for our USIS, Asia Pacific, Europe, Latin America, Canada, and GCS reporting units generally includes two global consumer credit reporting companies, Experian and TransUnion, both of which offer a product suite similar to our credit reporting solutions. Additionally, for our GCS reporting unit, competition includes LifeLock, a national provider of personal identity theft protection products. Competition for our Verification Services and Employer Services reporting units includes payroll processors such as ADP and Paychex. Valuation multiples were selected based on a financial benchmarking analysis that compared the reporting unit’s operating result with the comparable companies’ information. In addition to these financial considerations, qualitative factors such as variations in growth opportunities and overall risk among the benchmark companies were considered in the ultimate selection of the multiple.
The values separately derived from each of the income and market approach valuation techniques were used to develop an overall estimate of a reporting unit’s fair value. We use a consistent approach across all reporting units when considering the weight of the income and market approaches for calculating the fair value of each of our reporting units. This approach relies more heavily on the calculated fair value derived from the income approach, with 70% of the value coming from the income approach. We believe this approach is consistent with that of a market participant in valuing prospective
purchase business combinations. The selection and weighting of the various fair value techniques may result in a higher or lower fair value. Judgment is applied in determining the weightings that are most representative of fair value.
We have not made any material changes to the valuation methodology we use to assess goodwill impairment since the date of the last annual impairment test.
Growth Assumptions
The assumptions for our future cash flows begin with our historical operating performance, the details of which are described in our Management’s Discussion & Analysis of operating performance. Additionally, we consider the impact that known economic, industry and market trends will have on our future forecasts, as well as the impact that we expect from planned business initiatives including new product initiatives, client service and retention standards, and cost management programs. At the end of the forecast period, the long-term growth rate we used to determine the terminal value of each reporting unit was 3%, other than Asia Pacific and Latin America where we used a terminal growth rate of 5% and 5.5%, respectively, based on management’s assessment of the minimum expected terminal growth rate of the reporting unit, as well as broader economic considerations such as GDP, inflation and the maturity of the markets we serve.
We projected revenue growth in 2018 for our reporting units in completing our 2017 impairment testing based on planned business initiatives and prevailing trends exhibited by these units and not based on the assumption of meaningful acceleration in economic growth for all reporting units other than GCS. For GCS we expect revenue growth to decline in 2018 as compared to 2017 and then resume revenue growth in 2019. The anticipated revenue growth in our reporting units, however, is partially offset by assumed increases in expenses for a majority of our reporting units which reflect the additional level of investment needed in order to achieve the planned revenue growth. Additionally, we have factored in any estimable expected impacts of the cybersecurity incident as further discussed below.
Discount Rate Assumptions
We utilize a weighted average cost of capital, or WACC, in our impairment analysis that makes assumptions about the capital structure that we believe a market participant would make and include a risk premium based on an assessment of risks related to the projected cash flows of each reporting unit. We believe this approach yields a discount rate that is consistent with an implied rate of return that a market participant would require for an investment in a company having similar risks and business characteristics to the reporting unit being assessed. To calculate the WACC, the cost of equity and cost of debt are multiplied by the assumed capital structure of the reporting unit as compared to industry trends and relevant benchmark company structures. The cost of equity was computed using the Capital Asset Pricing Model which considers the risk-free interest rate, beta, equity risk premium and specific company risk premium related to a particular reporting unit. The cost of debt was computed using a benchmark rate and the Company’s tax rate. For the 2017 annual goodwill impairment evaluation, the discount rates used to develop the estimated fair value of the reporting units evaluated were as follows for each reporting unit:
|
| | |
| September 30, |
| 2017 |
| Discount rate |
U.S. Information Solutions | 9.0 | % |
Asia Pacific | 9.4 | % |
Europe | 8.8 | % |
Latin America | 15.5 | % |
Canada | 8.9 | % |
Global Consumer Solutions | 11.2 | % |
Verification Services | 8.5 | % |
Employer Services | 10.7 | % |
Because of assigned market premiums, discount rates are lowest for reporting units whose cash flows are expected to be less volatile due to such factors as the maturity of the market they serve, their position in that market or other macroeconomic factors. Where there is the greatest volatility of cash flows due to competition, or participation in less stable geographic markets than the United States, such as our Latin America reporting unit, the discount rate selected is in the higher
portion of the range as there is more inherent risk in the expected cash flows of that reporting unit. Additionally, for our USIS and GCS reporting units we utilized a higher beta to account for the additional volatility following the disclosure of the cybersecurity incident.
Estimated Fair Value and Sensitivities
The estimated fair value of the reporting units is derived from the valuation techniques described above, incorporating the related projections and assumptions. An indication of possible impairment occurs when the estimated fair value of the reporting unit is below the carrying value of its equity. The estimated fair value for our reporting units exceeded their related carrying value as of September 30, 2017. As a result, no goodwill impairment was recorded. The percentage by which the fair value of the reporting unit exceeds the carrying value ("cushion") as of September 30, 2017, was as follows:
|
| | |
| September 30, |
| 2017 |
| Cushion |
U.S. Information Solutions | 395 | % |
Asia Pacific | 5 | % |
Europe | 155 | % |
Latin America | 64 | % |
Canada | 1,472 | % |
Global Consumer Solutions | 141 | % |
Verification Services | 405 | % |
Employer Services | 58 | % |
The estimated fair value of the reporting unit is highly sensitive to changes in these projections and assumptions; therefore, in some instances changes in these assumptions could impact whether the fair value of a reporting unit is greater than its carrying value. For example, an increase in the discount rate and decline in the projected cumulative cash flow of a reporting unit could cause the fair value of certain reporting units to be below its carrying value. We perform sensitivity analyses around these assumptions in order to assess the reasonableness of the assumptions and the resulting estimated fair values. Ultimately, future potential changes in these assumptions may impact the estimated fair value of a reporting unit and cause the fair value of the reporting unit to be below its carrying value. Our Asia Pacific reporting unit primarily represents our recently completed acquisition of Veda. Due to the recency of this acquisition and its overall significance to the reporting unit, Asia Pacific is more sensitive to changes in assumptions noted above that would result in a fair value that is less than its carrying value.
We have incorporated updated forecasts following the cybersecurity incident that we disclosed during the third quarter of 2017. As we look forward, we expect our GCS reporting unit to be most impacted by the cybersecurity incident, reflecting the net reduction in U.S. subscribers as we discontinued marketing in the U.S. in September 2017. Our USIS and Workforce Solutions reporting units were also impacted by the cybersecurity incident, primarily a reduction in project revenue. Equifax will also incur costs related to the Lock & AlertTM free lifetime service being offered in the U.S. The impact of the cybersecurity incident continues to develop and could result in additional regulatory requirements that could further impact our U.S. based reporting units and could impact non-U.S. reporting units as well. We continue to monitor developments and their impact on our growth assumptions and future cash flows and will evaluate any significant changes in assumptions as they occur.
Additionally, a significant portion of the revenue for our Employer Services business relates to Affordable Care Act compliance services. As such, the fair value of this reporting unit would be impacted if the Affordable Care Act were to be repealed. We continue to monitor developments and their impact on our growth assumptions and future cash flows and will evaluate any significant changes in assumptions as they occur.
Loss Contingencies
We are subject to various proceedings, lawsuits and claims arising in the normal course of our business. We determine whether to disclose and/or accrue for loss contingencies based on our assessment of whether the potential loss is estimable, probable, reasonably possible or remote.
In the third quarter of fiscal 2017, we announced a cybersecurity incident potentially impacting U.S., Canadian and U.K. consumers. As a result of the cybersecurity incident, we are subject to a significant number of proceedings and investigations as described in Part I, "Item 3. Legal Proceedings." While we believe it is reasonably possible that we will incur losses associated with these proceedings and investigations, it is not possible to estimate the amount of loss or range of possible loss that might result from adverse judgments, settlements, penalties or other resolution of such proceedings and investigations based on the early stage of these proceedings and investigations, that alleged damages have not been specified, the uncertainty as to the certification of a class or classes and the size of any certified class, as applicable, and the lack of resolution on significant factual and legal issues.
Additionally, as a result of the cybersecurity incident, we offered free credit file monitoring and identity theft protection to all U.S. consumers. We have concluded that the costs associated with providing this service are a contingent liability that is probable and estimable. We have therefore recorded an estimate of the expenses necessary to provide this service to those who signed up. We have recorded $50.7 million through December 31, 2017 included in Selling, General and Administrative expenses in the accompanying Consolidated Statements of Income. As of December 31, 2017, $27.1 million remains outstanding in other current liabilities in the accompanying Consolidated Balance Sheets. Refer to Note 6 of the Notes to Consolidated Financial Statements in this Form 10-K for more information on the cybersecurity incident.
Judgments and uncertainties — We periodically review claims and legal proceedings and assess whether we have potential financial exposure based on consultation with internal and outside legal counsel and other advisors. If the likelihood of an adverse outcome from any claim or legal proceeding is probable and the amount can be reasonably estimated, we record a liability on our Consolidated Balance Sheets for the estimated amount. If the likelihood of an adverse outcome is reasonably possible, but not probable, we provide disclosures related to the potential loss contingency. Our assumptions related to loss contingencies are inherently subjective.
Effect if actual results differ from assumptions — With the exception of the cybersecurity incident, we do not believe there is a reasonable likelihood that there will be a material change in the future estimates or assumptions we use to determine loss contingencies. However, if facts and circumstances change in the future that change our belief regarding assumptions used to determine our estimates, we may be exposed to a loss that could be material.
Income Taxes
We record deferred income taxes using enacted tax laws and rates for the years in which the taxes are expected to be paid. We assess the likelihood that our deferred tax assets will be recovered from future taxable income or other tax planning strategies. To the extent that we believe that recovery is not likely, we must establish a valuation allowance to reduce the deferred tax assets to the amount we estimate will be recoverable.
Our income tax provisions are based on assumptions and calculations which will be subject to examination by various tax authorities. We record tax benefits for positions in which we believe are more likely than not of being sustained under such examinations. We assess the potential outcome of such examinations to determine the adequacy of our income tax accruals.
Judgments and uncertainties — We consider accounting for income taxes critical because management is required to make significant judgments in determining our provision for income taxes, our deferred tax assets and liabilities, and our future taxable income for purposes of assessing our ability to realize any future benefit from our deferred tax assets. These judgments and estimates are affected by our expectations of future taxable income, mix of earnings among different taxing jurisdictions, and timing of the reversal of deferred tax assets and liabilities.
We also use our judgment to determine whether it is more likely than not that we will sustain positions that we have taken on tax returns and, if so, the amount of benefit to initially recognize within our financial statements. We review our uncertain tax positions and adjust our unrecognized tax benefits in light of changes in facts and circumstances, such as changes in tax law, interactions with taxing authorities and developments in case law. These adjustments to our unrecognized tax benefits may affect our income tax expense. Settlement of uncertain tax positions may require use of our cash. At December 31, 2017, $38.0 million was recorded for uncertain tax benefits, including interest and penalties, of which it is reasonably possible that up to $18.3 million of our unrecognized tax benefit may change within the next twelve months.
Effect if actual results differ from assumptions — Although management believes that the judgments and estimates discussed herein are reasonable, actual results could differ, and we may be exposed to increases or decreases in income tax expense that could be material.
The Tax Cuts and Jobs Act of 2017 (“Tax Act”), as signed by the President of the United States on December 22, 2017, significantly revises U.S. tax law. The legislation will positively impact the Company’s ongoing effective tax rate due to the reduction of the U.S. federal corporate tax rate from 35% to 21%. The Tax Act makes major changes to the U.S. international tax system. Under previous law, foreign earnings were subject to U.S. tax when repatriated to the U.S. Under the Tax Act, foreign earnings are generally exempt from U.S. tax. Additionally, there is a one-time deemed repatriation tax on undistributed foreign earnings and profits (the “transition tax”). The Tax Act imposes other U.S. taxes on “global intangible low taxed income” and “base erosion anti-abuse transactions.” Other significant changes include limitations on the deductibility of interest expense and executive compensation, and repeal of the deduction for domestic production activities. As a result of the current interpretation and estimated impact of the Tax Act, the Company recorded adjustments totaling a net tax benefit of $48.3 million in the fourth quarter of 2017 to provisionally account for the estimated impact.
Our preliminary estimate of the tax rate change resulted in a remeasurement of our net deferred tax liabilities of $85.1 million and a corresponding deferred income tax benefit in 2017. Our federal income tax expense for periods beginning in 2018 will be based on the new rate.
As a result of the changes the Tax Act makes to the taxation of foreign earnings, we recorded a valuation allowance related to the foreign tax credit carryover in the amount of $17.6 million. Based on our initial estimates, the Company recorded zero transition tax related to the Tax Act. However, the Company recognized additional tax expense of $16.4 million due to the inability to claim foreign tax credits in the current year.
As permitted by Staff Accounting Bulletin No. 118, provisional amounts estimated based on information available as of December 31, 2017 have been made for the adjustments to deferred tax assets and liabilities, state taxes, equity compensation, the calculation of the transition tax, the valuation allowance related to the foreign tax credit carryover and the 2017 dividends. These amounts are subject to change as we obtain information necessary to complete the calculations and clarifications to the U.S. tax code as they occur. We will recognize any changes to the provisional amounts as we refine our estimates and our interpretations of the application of the 2017 Tax Act.
The Company has not yet made a policy election with respect to its treatment of potential global intangible low-taxed income (“GILTI”). Companies can either account for taxes on GILTI as incurred or recognize deferred taxes when basis differences exist that are expected to affect the amount of the GILTI inclusion upon reversal. The Company is still in the process of analyzing the provisions of the Act associated with GILTI and the expected impact of GILTI on the Company in the future. Refer to Note 7 of the Notes to Consolidated Financial Statements in this Form 10-K for additional information.
Pension and Other Postretirement Plans
We consider accounting for our U.S. and Canadian pension and other postretirement plans critical because management is required to make significant subjective judgments about a number of actuarial assumptions, which include discount rates, expected return on plan assets, interest cost and mortality and retirement rates. Actuarial valuations are used in determining our benefit obligation and net periodic benefit cost.
During 2017, we adopted the new MP-2017 mortality scale in determining the liability for the U.S. pension plan. This updated scale partially offset the decrease in the discount rate in 2017, the net of which resulted in the increase in the projected benefit obligation as of December 31, 2017.
During 2016, we adopted the new MP-2016 mortality scale in determining the liability for the U.S. pension plan. This updated scale partially offset the decrease in the discount rate in 2016, the net of which resulted in the increase in the projected benefit obligation as of December 31, 2016.
During 2015 we adopted the new MP-2015 in determining the liability for the U.S. pension plan. This updated scale, along with the change in the discount rate, contributed to the decrease in the projected benefit obligation as of December 31, 2015.
Judgments and uncertainties — We believe that the most significant assumptions related to our net periodic benefit cost are (1) the discount rate and (2) the expected return on plan assets, in each case as it relates to our U.S. pension plan. Our Canadian plan is not significant, and the impact of changes in assumptions for that plan is not material.
We determine our discount rates primarily based on high-quality, fixed-income investments and yield-to-maturity analysis specific to our estimated future benefit payments available as of the measurement date. Discount rates are updated annually on the measurement date to reflect current market conditions. We use a third-party yield curve to develop our discount
rates. The yield curve provides discount rates related to a dedicated high-quality bond portfolio whose cash flows extend beyond the current period, from which we choose a rate matched to the expected benefit payments required for each plan.
The expected rate of return on plan assets is based on both our historical returns and forecasted future investment returns by asset class, as provided by our external investment advisor. In 2017, our U.S. pension plan investment gain of 17.9% was above the expected return of 7.25% for the sixth time in nine years. The expected return for the USRIP for 2018 is 7.25%. The CRIP earned 7.8% in 2017 which was above its expected return of 6.0% for the seventh time in nine years. The expected return for the CRIP for 2018 is 6.0%. The CRIP has a lower expected return due to a higher asset allocation to fixed income securities. Our weighted-average expected rate of return for both plans for 2017 is 7.14% which is consistent with the 2016 expected rate.
Annual differences, if any, between the expected and actual returns on plan assets are included in unrecognized net actuarial gain or loss, a component of other comprehensive income. In calculating the annual amortization of the unrecognized net actuarial gain or loss, we use a market-related value of assets that smooths actual investment gains and losses on plan assets over a period up to five years. The resulting unrecognized net actuarial gain or loss amount is recognized in net periodic pension expense over the average remaining life expectancy of the participant group since almost all participants are inactive. The market-related value of our assets was $545.5 million at December 31, 2017. We do not expect our 2018 net periodic benefit cost, which includes the effect of the market-related value of assets, to be materially different than our 2017 cost. See Note 10 of the Notes to the Consolidated Financial Statements for details on changes in the pension benefit obligation and the fair value of plan assets.
Effect if actual results differ from assumptions — We do not believe there is a reasonable likelihood that there will be a material change in the future estimates or assumptions that are used in our actuarial valuations. Adjusting our weighted-average expected long-term rate of return (7.14% at December 31, 2017) by 50 basis points would change our estimated pension expense in 2017 by approximately $2.7 million. Adjusting our weighted-average discount rate (3.73% at December 31, 2017) by 50 basis points would change our estimated pension expense in 2017 by approximately $1.6 million. However, if actual results are not consistent with our estimates or assumptions, we may be exposed to changes in pension expense that could be material.
Purchase Accounting for Acquisitions
We account for acquisitions under Accounting Standards Codification 805, Business Combinations, which requires companies to record assets acquired and liabilities assumed at their respective fair market values at the date of acquisition. We primarily estimate fair value of identified intangible assets using discounted cash flow analyses based on market participant based inputs. Any amount of the purchase price paid that is in excess of the estimated fair values of net assets acquired is recorded in the line item Goodwill in our Consolidated Balance Sheets. Transaction costs, as well as costs to reorganize acquired companies, are expensed as incurred in our Consolidated Statements of Income.
Judgments and uncertainties — We consider accounting for business combinations critical because management's judgment is used to determine the estimated fair values assigned to assets acquired and liabilities assumed and amortization periods for intangible assets, which can materially affect our results of operations.
Effect if actual results differ from assumptions — Although management believes that the judgments and estimates discussed herein are reasonable, actual results could differ, and we may be exposed to an impairment charge if we are unable to recover the value of the recorded net assets.
ITEM 7A. QUANTITATIVE AND QUALITATIVE DISCLOSURES ABOUT MARKET RISK
In the normal course of our business, we are exposed to market risk, primarily from changes in foreign currency exchange rates and interest rates that could impact our results of operations and financial position. We manage our exposure to these market risks through our regular operating and financing activities, and, when deemed appropriate, through the use of derivative financial instruments, such as interest rate swaps, to hedge certain of these exposures. We use derivative financial instruments as risk management tools and not for speculative or trading purposes.
Foreign Currency Exchange Rate Risk
A substantial majority of our revenue, expense and capital expenditure activities are transacted in U.S. dollars. However, we do transact business in other currencies, primarily the British pound, the Australian dollar, the Canadian dollar, the Chilean peso, the Argentine peso and the Euro. For most of these foreign currencies, we are a net recipient, and, therefore, benefit from a weaker U.S. dollar and are adversely affected by a stronger U.S. dollar relative to the foreign currencies in which we transact significant amounts of business.
We are required to translate, or express in U.S. dollars, the assets and liabilities of our foreign subsidiaries that are denominated or measured in foreign currencies at the applicable year-end rate of exchange on our Consolidated Balance Sheets and income statement items of our foreign subsidiaries at the average rates prevailing during the year. We record the resulting translation adjustment, and gains and losses resulting from the translation of intercompany balances of a long-term investment nature within other comprehensive income, as a component of our shareholders’ equity. Foreign currency transaction gains and losses, which have historically been immaterial, are recorded on our Consolidated Statements of Income. We generally do not mitigate the risks associated with fluctuating exchange rates, although we may from time to time through forward contracts or other derivative instruments hedge a portion of our translational foreign currency exposure or exchange rate risks associated with material transactions which are denominated in a foreign currency.
For the year ended December 31, 2017, a 10% weaker U.S. dollar against the currencies of all foreign countries in which we had operations during 2017 would have increased our revenue by $54.7 million and our pre-tax operating profit by $18.6 million. For the year ended December 31, 2016, a 10% weaker U.S. dollar against the currencies of all foreign countries in which we had operations during 2016 would have increased our revenue by $50.2 million and our pre-tax operating profit by $16.5 million. A 10% stronger U.S. dollar would have resulted in similar decreases to our revenue and pre-tax operating profit for 2017 and 2016.
On average across our mix of international businesses, foreign currencies at December 31, 2017, were weaker against the U.S. dollar than the average foreign exchange rates that prevailed across the full year 2017. As a result, if foreign exchange rates were unchanged throughout 2018, foreign exchange translation would reduce growth as reported in U.S. dollars. As foreign exchange rates change daily, there can be no assurance that foreign exchange rates will remain constant throughout 2018, and rates could go either higher or lower.
Interest Rate Risk
Our exposure to market risk for changes in interest rates relates to our variable-rate commercial paper borrowings. We attempt to achieve the lowest all-in weighted-average cost of debt while simultaneously taking into account the mix of our fixed- and floating-rate debt, and the average life and scheduled maturities of our debt. At December 31, 2017, our weighted average cost of debt was 3.4% and weighted-average life of debt was 4.95 years. At December 31, 2017, 61% of our debt was fixed rate, and the remaining 39% was variable rate. Occasionally we use derivatives to manage our exposure to changes in interest rates by entering into interest rate swaps. A 100 basis point increase in the weighted-average interest rate on our variable-rate debt would have increased our 2017 interest expense by $10.6 million.
Based on the amount of outstanding variable-rate debt, we have exposure to interest rate risk. In the future, if our mix of fixed-rate and variable-rate debt were to change due to additional borrowings under existing or new variable-rate debt, we could have additional exposure to interest rate risk. The nature and amount of our long-term and short-term debt, as well as the proportionate amount of fixed-rate and variable-rate debt, can be expected to vary as a result of future business requirements, market conditions and other factors.
ITEM 8. FINANCIAL STATEMENTS AND SUPPLEMENTARY DATA
|
| |
Index to Financial Statements | |
| |
| |
| |
| |
| |
| |
| |
| |
Report of Independent Registered Public Accounting Firm
To the Shareholders and the Board of Directors of Equifax Inc.
Opinion on Internal Control over Financial Reporting
We have audited Equifax Inc.’s internal control over financial reporting as of December 31, 2017, based on criteria established in Internal Control-Integrated Framework issued by the Committee of Sponsoring Organizations of the Treadway Commission (“2013 framework”) (the COSO criteria). In our opinion, Equifax Inc. (the Company) maintained, in all material respects, effective internal control over financial reporting as of December 31, 2017, based on the COSO criteria.
We also have audited, in accordance with the standards of the Public Company Accounting Oversight Board (United States) (PCAOB), the consolidated balance sheets of the Company as of December 31, 2017 and 2016, the related consolidated statements of income, comprehensive income, cash flows, and shareholders’ equity and other comprehensive income for each of the three years in the period ended December 31, 2017, and the related notes and financial statement schedule listed in the Index at Item 15(a)(2) (collectively referred to as the "consolidated financial statements") and our report dated March 1, 2018 expressed an unqualified opinion thereon.
Basis for Opinion
The Company’s management is responsible for maintaining effective internal control over financial reporting and for its assessment of the effectiveness of internal control over financial reporting included in the accompanying Management’s Annual Report on Internal Control over Financial Reporting. Our responsibility is to express an opinion on the Company’s internal control over financial reporting based on our audit. We are a public accounting firm registered with the PCAOB and are required to be independent with respect to the Company in accordance with the U.S. federal securities laws and the applicable rules and regulations of the Securities and Exchange Commission and the PCAOB.
We conducted our audit in accordance with the standards of the PCAOB. Those standards require that we plan and perform the audit to obtain reasonable assurance about whether effective internal control over financial reporting was maintained in all material respects.
Our audit included obtaining an understanding of internal control over financial reporting, assessing the risk that a material weakness exists, testing and evaluating the design and operating effectiveness of internal control based on the assessed risk, and performing such other procedures as we considered necessary in the circumstances. We believe that our audit provides a reasonable basis for our opinion.
Definition and Limitations of Internal Control Over Financial Reporting
A company’s internal control over financial reporting is a process designed to provide reasonable assurance regarding the reliability of financial reporting and the preparation of financial statements for external purposes in accordance with generally accepted accounting principles. A company’s internal control over financial reporting includes those policies and procedures that (1) pertain to the maintenance of records that, in reasonable detail, accurately and fairly reflect the transactions and dispositions of the assets of the company; (2) provide reasonable assurance that transactions are recorded as necessary to permit preparation of financial statements in accordance with generally accepted accounting principles, and that receipts and expenditures of the company are being made only in accordance with authorizations of management and directors of the company; and (3) provide reasonable assurance regarding prevention or timely detection of unauthorized acquisition, use, or disposition of the company’s assets that could have a material effect on the financial statements.
Because of its inherent limitations, internal control over financial reporting may not prevent or detect misstatements. Also, projections of any evaluation of effectiveness to future periods are subject to the risk that controls may become inadequate because of changes in conditions, or that the degree of compliance with the policies or procedures may deteriorate.
/s/ Ernst & Young LLP
Atlanta, Georgia
March 1, 2018
Report of Independent Registered Public Accounting Firm
To the Shareholders and the Board of Directors of Equifax Inc.
Opinion on the Consolidated Financial Statements
We have audited the accompanying consolidated balance sheets of Equifax Inc. (the Company) as of December 31, 2017 and 2016, the related consolidated statements of income, comprehensive income, cash flows, and shareholders’ equity and other comprehensive income for each of the three years in the period ended December 31, 2017, and the related notes and financial statement schedule listed in the Index at Item 15(a)(2) (collectively referred to as the “consolidated financial statements”). In our opinion, the consolidated financial statements present fairly, in all material respects, the financial position of the Company at December 31, 2017 and 2016, and the results of its operations and its cash flows for each of the three years in the period ended December 31, 2017, in conformity with U.S. generally accepted accounting principles.
We also have audited, in accordance with the standards of the Public Company Accounting Oversight Board (United States) (PCAOB), the Company's internal control over financial reporting as of December 31, 2017, based on criteria established in Internal Control-Integrated Framework issued by the Committee of Sponsoring Organizations of the Treadway Commission (2013 framework) and our report dated March 1, 2018 expressed an unqualified opinion thereon.
Basis for Opinion
These consolidated financial statements are the responsibility of the Company's management. Our responsibility is to express an opinion on the Company’s consolidated financial statements based on our audits. We are a public accounting firm registered with the PCAOB and are required to be independent with respect to the Company in accordance with the U.S. federal securities laws and the applicable rules and regulations of the Securities and Exchange Commission and the PCAOB.
We conducted our audits in accordance with the standards of the PCAOB. Those standards require that we plan and perform the audit to obtain reasonable assurance about whether the consolidated financial statements are free of material misstatement, whether due to error or fraud. Our audits included performing procedures to assess the risk of material misstatements of the consolidated financial statements, whether due to error or fraud, and performing procedures that respond to those risks. Such procedures included examining, on a test basis, evidence regarding the amounts and disclosures in the consolidated financial statements. Our audits also included evaluating the accounting principles used and significant estimates made by management, as well as evaluating the overall presentation of the consolidated financial statements. We believe that our audits provide a reasonable basis for our opinion.
/s/ Ernst & Young LLP
We have served as the Company’s auditor since 2002.
Atlanta, Georgia
March 1, 2018
CONSOLIDATED STATEMENTS OF INCOME
|
| | | | | | | | | | | |
| Twelve Months Ended
December 31, |
| 2017 | | 2016 | | 2015 |
(In millions, except per share amounts) | |
| | |
| | |
|
Operating revenue | $ | 3,362.2 |
| | $ | 3,144.9 |
| | $ | 2,663.6 |
|
Operating expenses: | |
| | |
| | |
|
Cost of services (exclusive of depreciation and amortization below) | 1,210.7 |
| | 1,113.4 |
| | 887.4 |
|
Selling, general and administrative expenses | 1,039.1 |
| | 948.2 |
| | 884.3 |
|
Depreciation and amortization | 287.8 |
| | 265.4 |
| | 198.0 |
|
Total operating expenses | 2,537.6 |
| | 2,327.0 |
| | 1,969.7 |
|
Operating income | 824.6 |
| | 817.9 |
| | 693.9 |
|
Interest expense | (92.8 | ) | | (92.1 | ) | | (63.8 | ) |
Other income, net | 14.8 |
| | 2.4 |
| | 6.5 |
|
Consolidated income before income taxes | 746.6 |
| | 728.2 |
| | 636.6 |
|
Provision for income taxes | (148.6 | ) | | (233.1 | ) | | (201.8 | ) |
Consolidated net income | 598.0 |
| | 495.1 |
| | 434.8 |
|
Less: Net income attributable to noncontrolling interests including redeemable noncontrolling interests | (10.7 | ) | | (6.3 | ) | | (5.7 | ) |
Net income attributable to Equifax | $ | 587.3 |
| | $ | 488.8 |
| | $ | 429.1 |
|
Basic earnings per common share: | |
| | |
| | |
|
Net income attributable to Equifax | $ | 4.89 |
| | $ | 4.10 |
| | $ | 3.61 |
|
Weighted-average shares used in computing basic earnings per share | 120.1 |
| | 119.3 |
| | 118.7 |
|
Diluted earnings per common share: | |
| | |
| | |
|
Net income attributable to Equifax | $ | 4.83 |
| | $ | 4.04 |
| | $ | 3.55 |
|
Weighted-average shares used in computing diluted earnings per share | 121.5 |
| | 121.1 |
| | 120.9 |
|
Dividends per common share | $ | 1.56 |
| | $ | 1.32 |
| | $ | 1.16 |
|
See Notes to Consolidated Financial Statements.
CONSOLIDATED STATEMENTS OF COMPREHENSIVE INCOME
|
| | | | | | | | | | | | | | | | | | | | | | | | | | | | | | | | | | | |
| Twelve Months Ended December 31, |
| 2017 | | 2016 | | 2015 |
| Equifax Shareholders | | Noncontrolling Interests | | Total | | Equifax Shareholders | | Noncontrolling Interests | | Total | | Equifax Shareholders | | Noncontrolling Interests | | Total |
| (In millions) |
Net income | $ | 587.3 |
| | $ | 10.7 |
| | $ | 598.0 |
| | $ | 488.8 |
| | $ | 6.3 |
| | $ | 495.1 |
| | $ | 429.1 |
| | $ | 5.7 |
| | $ | 434.8 |
|
Other comprehensive income (loss): | |
| | |
| | |
| | |
| | |
| | |
| | |
| | |
| | |
|
Foreign currency translation adjustment | 158.7 |
| | 3.3 |
| | 162.0 |
| | (24.6 | ) | | (3.0 | ) | | (27.6 | ) | | (67.1 | ) | | (7.1 | ) | | (74.2 | ) |
Change in unrecognized prior service cost and actuarial gains (losses) related to our pension and other postretirement benefit plans, net | 8.4 |
| | — |
| | 8.4 |
| | (20.1 | ) | | — |
| | (20.1 | ) | | 17.5 |
| | — |
| | 17.5 |
|
Change in cumulative gain (loss) from cash flow hedging transactions, net | (0.2 | ) | | — |
| | (0.2 | ) | | 0.6 |
| | — |
| | 0.6 |
| | 0.2 |
| | — |
| | 0.2 |
|
Comprehensive income (loss) | $ | 754.2 |
| | $ | 14.0 |
| | $ | 768.2 |
| | $ | 444.7 |
| | $ | 3.3 |
| | $ | 448.0 |
| | $ | 379.7 |
| | $ | (1.4 | ) | | $ | 378.3 |
|
See Notes to Consolidated Financial Statements.
CONSOLIDATED BALANCE SHEETS
|
| | | | | | | |
| December 31, |
| 2017 | | 2016 |
(In millions, except par values) | |
| | |
|
ASSETS | |
| | |
|
Current assets: | |
| | |
|
Cash and cash equivalents | $ | 336.4 |
| | $ | 129.3 |
|
Trade accounts receivable, net of allowance for doubtful accounts of $9.1 and $7.8 at
December 31, 2017 and 2016, respectively | 444.8 |
| | 433.3 |
|
Prepaid expenses | 94.3 |
| | 60.2 |
|
Other current assets | 122.9 |
| | 50.1 |
|
Total current assets | 998.4 |
| | 672.9 |
|
Property and equipment: | |
| | |
|
Capitalized internal-use software and system costs | 427.9 |
| | 307.0 |
|
Data processing equipment and furniture | 306.6 |
| | 273.2 |
|
Land, buildings and improvements | 212.5 |
| | 203.8 |
|
Total property and equipment | 947.0 |
| | 784.0 |
|
Less accumulated depreciation and amortization | (380.0 | ) | | (317.1 | ) |
Total property and equipment, net | 567.0 |
| | 466.9 |
|
|
|
| | |
Goodwill | 4,184.0 |
| | 3,974.3 |
|
Indefinite-lived intangible assets | 95.0 |
| | 94.8 |
|
Purchased intangible assets, net | 1,247.0 |
| | 1,323.8 |
|
Other assets, net | 142.0 |
| | 131.3 |
|
Total assets | $ | 7,233.4 |
| | $ | 6,664.0 |
|
LIABILITIES AND EQUITY | |
| | |
|
Current liabilities: | |
| | |
|
Short-term debt and current maturities of long-term debt | $ | 965.3 |
| | $ | 585.4 |
|
Accounts payable | 110.3 |
| | 81.0 |
|
Accrued expenses | 160.9 |
| | 149.3 |
|
Accrued salaries and bonuses | 119.4 |
| | 158.8 |
|
Deferred revenue | 108.4 |
| | 110.7 |
|
Other current liabilities | 209.2 |
| | 174.4 |
|
Total current liabilities | 1,673.5 |
| | 1,259.6 |
|
Long-term debt | 1,739.0 |
| | 2,086.8 |
|
Deferred income tax liabilities, net | 305.1 |
| | 325.4 |
|
Long-term pension and other postretirement benefit liabilities | 175.8 |
| | 184.4 |
|
Other long-term liabilities | 101.0 |
| | 86.5 |
|
Total liabilities | 3,994.4 |
| | 3,942.7 |
|
Commitments and Contingencies (see Note 6) |
|
| |
|
|
Equifax shareholders' equity: | |
| | |
|
Preferred stock, $0.01 par value: Authorized shares - 10.0; Issued shares - none | — |
| | — |
|
Common stock, $1.25 par value: Authorized shares - 300.0;
Issued shares - 189.3 at December 31, 2017 and 2016;
Outstanding shares - 120.1 and 119.9 at December 31, 2017 and 2016, respectively | 236.6 |
| | 236.6 |
|
Paid-in capital | 1,332.7 |
| | 1,313.3 |
|
Retained earnings | 4,600.6 |
| | 4,153.2 |
|
Accumulated other comprehensive loss | (412.0 | ) | | (528.9 | ) |
Treasury stock, at cost, 68.6 shares and 68.8 shares at December 31, 2017 and 2016,
respectively | (2,577.6 | ) | | (2,505.6 | ) |
Stock held by employee benefits trusts, at cost, 0.6 shares at December 31, 2017 and 2016 | (5.9 | ) | | (5.9 | ) |
Total Equifax shareholders' equity | 3,174.4 |
| | 2,662.7 |
|
Noncontrolling interests including redeemable noncontrolling interests | 64.6 |
| | 58.6 |
|
Total shareholders' equity | 3,239.0 |
| | 2,721.3 |
|
Total liabilities and equity | $ | 7,233.4 |
| | $ | 6,664.0 |
|
See Notes to Consolidated Financial Statements.
CONSOLIDATED STATEMENTS OF CASH FLOWS
|
| | | | | | | | | | | |
| Twelve Months Ended
December 31, |
| 2017 | | 2016 | | 2015 |
(In millions) | | | |
| | |
|
Operating activities: | | | |
| | |
|
Consolidated net income | $ | 598.0 |
| | $ | 495.1 |
| | $ | 434.8 |
|
Adjustments to reconcile consolidated net income to net cash provided by operating activities: | | | | | |
Impairment of cost method investment | — |
| | — |
| | 14.8 |
|
Depreciation and amortization | 290.9 |
| | 268.7 |
| | 200.0 |
|
Stock-based compensation expense | 38.3 |
| | 37.1 |
| | 38.4 |
|
Excess tax benefits from stock-based compensation plans | — |
| | (35.9 | ) | | (30.0 | ) |
Deferred income taxes | (44.1 | ) | | (13.0 | ) | | (28.7 | ) |
Changes in assets and liabilities, excluding effects of acquisitions: | | | | | |
Accounts receivable, net | (1.3 | ) | | (55.7 | ) | | (26.9 | ) |
Other assets, current and long-term | (120.1 | ) | | 0.3 |
| | 15.9 |
|
Current and long-term liabilities, excluding debt | 54.3 |
| | 126.4 |
| | 150.8 |
|
Cash provided by operating activities | 816.0 |
| | 823.0 |
| | 769.1 |
|
Investing activities: | | | |
| | |
|
Capital expenditures | (218.2 | ) | | (173.5 | ) | | (146.2 | ) |
Acquisitions, net of cash acquired | (139.9 | ) | | (1,791.6 | ) | | (4.4 | ) |
Cash received from sale of asset | 8.6 |
| | — |
| | — |
|
Cash received from divestitures | — |
| | — |
| | 2.9 |
|
Economic hedges | — |
| | (10.8 | ) | | — |
|
Investment in unconsolidated affiliates, net | — |
| | — |
| | (0.1 | ) |
Cash used in investing activities | (349.5 | ) | | (1,975.9 | ) | | (147.8 | ) |
Financing activities: | | | |
| | |
|
Net short-term borrowings (repayments) | 252.4 |
| | 73.0 |
| | (331.0 | ) |
Payments on long-term debt | (322.5 | ) | | (350.0 | ) | | — |
|
Proceeds from issuance of long-term debt | 100.0 |
| | 1,574.7 |
| | — |
|
Treasury stock purchases | (77.1 | ) | | — |
| | (196.3 | ) |
Dividends paid to Equifax shareholders | (187.4 | ) | | (157.6 | ) | | (137.8 | ) |
Dividends paid to noncontrolling interests | (8.4 | ) | | (5.8 | ) | | (6.4 | ) |
Proceeds from exercise of stock options | 19.2 |
| | 31.5 |
| | 34.4 |
|
Payment of taxes related to settlement of equity awards | (33.5 | ) | | (27.2 | ) | | (27.0 | ) |
Excess tax benefits from stock-based compensation plans | — |
| | 35.9 |
| | 30.0 |
|
Payment of contingent consideration | (3.5 | ) | | (4.4 | ) | | — |
|
Purchase of redeemable noncontrolling interests | (2.6 | ) | | (3.6 | ) | | — |
|
Debt issuance costs | (0.3 | ) | | (6.2 | ) | | (4.9 | ) |
Cash (used in) provided by financing activities | (263.7 | ) | | 1,160.3 |
| | (639.0 | ) |
Effect of foreign currency exchange rates on cash and cash equivalents | 4.3 |
| | 28.6 |
| | (17.3 | ) |
Increase (decrease) in cash and cash equivalents | 207.1 |
| | 36.0 |
| | (35.0 | ) |
Cash and cash equivalents, beginning of period | 129.3 |
| | 93.3 |
| | 128.3 |
|
Cash and cash equivalents, end of period | $ | 336.4 |
| | $ | 129.3 |
| | $ | 93.3 |
|
See Notes to Consolidated Financial Statements.
CONSOLIDATED STATEMENTS OF SHAREHOLDERS’ EQUITY AND OTHER COMPREHENSIVE INCOME
|
| | | | | | | | | | | | | | | | | | | | | | | | | | | | | | | | | | |
| Equifax Shareholders | | | | |
| Common Stock | | Paid-In Capital | | Retained Earnings | | Accumulated Other Comprehensive Loss | | Treasury Stock | | Stock Held By Employee Benefits Trusts | | Noncontrolling Interests | | Total Shareholders’ Equity |
| Shares Outstanding | | Amount | | | | | | | |
| (In millions, except per share values) |
Balance, December 31, 2014 | 119.4 |
| | $ | 236.6 |
| | $ | 1,201.7 |
| | $ | 3,554.8 |
| | $ | (435.4 | ) | | $ | (2,351.7 | ) | | $ | (5.9 | ) | | $ | 34.5 |
| | $ | 2,234.6 |
|
|
|
| |
|
| |
|
| |
|
| |
|
| |
|
| |
|
| |
|
| |
|
|
Net income | — |
| | — |
| | — |
| | 429.1 |
| | — |
| | — |
| | — |
| | 5.7 |
| | 434.8 |
|
Other comprehensive loss | — |
| | — |
| | — |
| | — |
| | (49.4 | ) | | — |
| | — |
| | (7.1 | ) | | (56.5 | ) |
Shares issued under stock and benefit plans, net of minimum tax withholdings | 1.4 |
| | — |
| | (21.8 | ) | | — |
| | — |
| | 29.6 |
| | — |
| | — |
| | 7.8 |
|
Treasury stock purchased under share repurchase program ($76.55 per share) | (2.1 | ) | | — |
| | — |
| | — |
| | — |
| | (207.8 | ) | | — |
| | — |
| | (207.8 | ) |
Cash dividends ($1.16 per share) | — |
| | — |
| | — |
| | (138.4 | ) | | — |
| | — |
| | — |
| | — |
| | (138.4 | ) |
Dividends paid to employee benefits trusts | — |
| | — |
| | 0.6 |
| | — |
| | — |
| | — |
| | — |
| | — |
| | 0.6 |
|
Stock-based compensation expense | — |
| | — |
| | 38.4 |
| | — |
| | — |
| | — |
| | — |
| | — |
| | 38.4 |
|
Tax effects of stock-based compensation plans | — |
| | — |
| | 30.0 |
| | — |
| | — |
| | — |
| | — |
| | — |
| | 30.0 |
|
Contributions from noncontrolling interests | — |
| | — |
| | — |
| | — |
| | — |
| | — |
| | — |
| | 1.5 |
| | 1.5 |
|
Redeemable noncontrolling interest adjustment | — |
| | — |
| | — |
| | (11.1 | ) | | — |
| | — |
| | — |
| | 11.1 |
| | — |
|
Dividends paid to noncontrolling interests | — |
| | — |
| | — |
| | — |
| | — |
| | — |
| | — |
| | (6.4 | ) | | (6.4 | ) |
Purchase of noncontrolling interests | — |
| | — |
| | 0.1 |
| | — |
| | — |
| | — |
| | — |
| | 0.2 |
| | 0.3 |
|
Other* | — |
| | — |
| | 11.5 |
| | — |
| | — |
| | — |
| | — |
| | — |
| | 11.5 |
|
Balance, December 31, 2015 | 118.7 |
| | 236.6 |
| | 1,260.5 |
| | 3,834.4 |
| | (484.8 | ) | | (2,529.9 | ) | | (5.9 | ) | | 39.5 |
| | 2,350.4 |
|
| | | | | | | | | | | | | | | | | |
Net income | — |
| | — |
| | — |
| | 488.8 |
| | — |
| | — |
| | — |
| | 6.3 |
| | 495.1 |
|
Other comprehensive loss | — |
| | — |
| | — |
| | — |
| | (44.1 | ) | | — |
| | — |
| | (3.0 | ) | | (47.1 | ) |
Shares issued under stock and benefit plans, net of minimum tax withholdings | 1.2 |
| | — |
| | (19.4 | ) | | — |
| | — |
| | 24.3 |
| | — |
| | — |
| | 4.9 |
|
Cash dividends ($1.32 per share) | — |
| | — |
| | — |
| | (158.4 | ) | | — |
| | — |
| | — |
| | — |
| | (158.4 | ) |
Dividends paid to employee benefits trusts | — |
| | — |
| | 0.8 |
| | — |
| | — |
| | — |
| | — |
| | — |
| | 0.8 |
|
Stock-based compensation expense | — |
| | — |
| | 37.1 |
| | — |
| | — |
| | — |
| | — |
| | — |
| | 37.1 |
|
Tax effects of stock-based compensation plans | — |
| | — |
| | 35.9 |
| | — |
| | — |
| | — |
| | — |
| | — |
| | 35.9 |
|
Redeemable noncontrolling interest adjustment | — |
| | — |
| | — |
| | (11.6 | ) | | — |
| | — |
| | — |
| | 11.6 |
| | — |
|
Dividends paid to noncontrolling interests | — |
| | — |
| | — |
| | — |
| | — |
| | — |
| | — |
| | (5.8 | ) | | (5.8 | ) |
Purchase of noncontrolling interests | — |
| | — |
| | (1.6 | ) | | — |
| | — |
| | — |
| | — |
| | 3.3 |
| | 1.7 |
|
Other | — |
| | — |
| | — |
| | — |
| | — |
| | — |
| | — |
| | 6.7 |
| | 6.7 |
|
Balance, December 31, 2016 | 119.9 |
| | 236.6 |
| | 1,313.3 |
| | 4,153.2 |
| | (528.9 | ) | | (2,505.6 | ) | | (5.9 | ) | | 58.6 |
| | 2,721.3 |
|
|
|
| |
|
| |
|
| |
|
| |
|
| |
|
| |
|
| |
|
| |
|
|
Net income | — |
|
| — |
|
| — |
|
| 587.3 |
|
| — |
|
| — |
|
| — |
|
| 10.7 |
|
| 598.0 |
|
Other comprehensive income | — |
|
| — |
|
| — |
|
| — |
|
| 166.9 |
|
| — |
|
| — |
|
| 3.3 |
|
| 170.2 |
|
Shares issued under stock and benefit plans, net of minimum tax withholdings | 0.7 |
|
| — |
|
| (18.8 | ) |
| — |
|
| — |
|
| 5.1 |
|
| — |
|
| — |
|
| (13.7 | ) |
Impact of Tax Cuts and Jobs Act of 2017 | — |
| | — |
| | — |
| | 50.0 |
| | (50.0 | ) | | — |
| | — |
| | — |
| | — |
|
Treasury stock purchased under share repurchase program ($143.88 per share)** | (0.5 | ) |
| — |
|
| — |
|
| — |
|
| — |
|
| (77.1 | ) |
| — |
|
| — |
|
| (77.1 | ) |
Cash dividends ($1.56 per share) | — |
|
| — |
|
| — |
|
| (188.3 | ) |
| — |
|
| — |
|
| — |
|
| — |
|
| (188.3 | ) |
Dividends paid to employee benefits trusts | — |
|
| — |
|
| 0.9 |
|
| — |
|
| — |
|
| — |
|
| — |
|
| — |
|
| 0.9 |
|
Stock-based compensation expense | — |
|
| — |
|
| 38.3 |
|
| — |
|
| — |
|
| — |
|
| — |
|
| — |
|
| 38.3 |
|
Redeemable noncontrolling interest adjustment | — |
|
| — |
|
| — |
|
| (1.5 | ) |
| — |
|
| — |
|
| — |
|
| 1.5 |
|
| — |
|
Dividends paid to noncontrolling interests | — |
|
| — |
|
| — |
|
| — |
|
| — |
|
| — |
|
| — |
|
| (8.4 | ) |
| (8.4 | ) |
Purchases of redeemable noncontrolling interests | — |
|
| — |
|
| (1.0 | ) |
| — |
|
| — |
|
| — |
|
| — |
|
| (1.6 | ) |
| (2.6 | ) |
Other | — |
|
| — |
|
| — |
|
| (0.1 | ) |
| — |
|
| — |
|
| — |
|
| 0.5 |
|
| 0.4 |
|
Balance, December 31, 2017 | 120.1 |
|
| $ | 236.6 |
|
| $ | 1,332.7 |
|
| $ | 4,600.6 |
|
| $ | (412.0 | ) |
| $ | (2,577.6 | ) |
| $ | (5.9 | ) |
| $ | 64.6 |
|
| $ | 3,239.0 |
|
| |
* | At December 31, 2015, the paid-in capital includes the $11.5 million holdback related to the accelerated share repurchase program discussed in Note 1. At December 31, 2015, the paid-in capital reflects the $11.5 million settlement of the accelerated share repurchase program discussed in Note 1. |
| |
** | At December 31, 2017, $590.1 million was authorized for future repurchases of our common stock. |
See Notes to Consolidated Financial Statements.
CONSOLIDATED STATEMENTS OF SHAREHOLDERS’ EQUITY AND OTHER COMPREHENSIVE INCOME
Accumulated Other Comprehensive Loss consists of the following components:
|
| | | | | | | | | | | |
| December 31, |
| 2017 | | 2016 | | 2015 |
| (In millions) |
Foreign currency translation | $ | (103.3 | ) | | $ | (262.0 | ) | | $ | (237.4 | ) |
Unrecognized actuarial losses and prior service cost related to our pension and other postretirement benefit plans, net of accumulated tax of $95.6, $150.6 and $138.2 in 2017, 2016 and 2015, respectively | (257.5 | ) | | (265.9 | ) | | (245.8 | ) |
Cash flow hedging transactions, net of tax of $0.7, $0.9 and $1.0 in 2017, 2016 and 2015, respectively | (1.2 | ) | | (1.0 | ) | | (1.6 | ) |
Impact of Tax Cuts and Jobs Act of 2017 | (50.0 | ) | | — |
| | — |
|
Accumulated other comprehensive loss | $ | (412.0 | ) | | $ | (528.9 | ) | | $ | (484.8 | ) |
See Notes to Consolidated Financial Statements.
NOTES TO CONSOLIDATED FINANCIAL STATEMENTS
1. SUMMARY OF SIGNIFICANT ACCOUNTING POLICIES
As used herein, the terms Equifax, the Company, we, our and us refer to Equifax Inc., a Georgia corporation, and its consolidated subsidiaries as a combined entity, except where it is clear that the terms mean only Equifax Inc.
Nature of Operations. We collect, organize and manage various types of financial, demographic, employment and marketing information. Our products and services enable businesses to make credit and service decisions, manage their portfolio risk, automate or outsource certain payroll-related, tax and human resources business processes, and develop marketing strategies concerning consumers and commercial enterprises. We serve customers across a wide range of industries, including the financial services, mortgage, retail, telecommunications, utilities, automotive, brokerage, healthcare and insurance industries, as well as government agencies. We also enable consumers to manage and protect their financial health through a portfolio of products offered directly to consumers. As of December 31, 2017, we operated in the following countries: Argentina, Australia, Canada, Chile, Costa Rica, Ecuador, El Salvador, Honduras, India, Ireland, Mexico, New Zealand, Paraguay, Peru, Portugal, Spain, the United Kingdom, or U.K., Uruguay, and the United States of America, or U.S. We also offer Equifax branded credit services in India and Russia through joint ventures, we have investments in consumer and/or commercial credit information companies through joint ventures in Cambodia, Malaysia, Singapore and Dubai, and have an investment in a consumer and commercial credit information company in Brazil.
We develop, maintain and enhance secured proprietary information databases through the compilation of consumer specific data, including credit, income, employment, asset, liquidity, net worth and spending activity, and business data, including credit and business demographics, that we obtain from a variety of sources, such as credit granting institutions, and income and tax information primarily from large to mid-sized companies in the U.S. We process this information utilizing our proprietary information management systems. We also provide information, technology and services to support debt collections and recovery management.
Basis of Consolidation. Our Consolidated Financial Statements and the accompanying notes, which are prepared in accordance with U.S. generally accepted accounting principles, or GAAP, include Equifax and all its subsidiaries. We consolidate all majority-owned and controlled subsidiaries as well as variable interest entities in which we are the primary beneficiary. Other parties’ interests in consolidated entities are reported as noncontrolling interests. We use the equity method of accounting for investments in which we are able to exercise significant influence and use the cost method for all other investments. All intercompany transactions and balances are eliminated.
Our Consolidated Financial Statements reflect all adjustments which are, in the opinion of management, necessary for a fair presentation of the periods presented therein.
Segments. We manage our business and report our financial results through the following four reportable segments, which are our operating segments:
| |
• | U.S. Information Solutions, or USIS |
| |
• | Global Consumer Solutions |
USIS is our largest reportable segment, with 37% of total operating revenue for 2017. Our most significant foreign operations are located in Australia, the U.K. and Canada.
Use of Estimates. The preparation of our Consolidated Financial Statements requires us to make estimates and assumptions in accordance with GAAP. Accordingly, we make these estimates and assumptions after exercising judgment. We believe that the estimates and assumptions inherent in our Consolidated Financial Statements are reasonable, based upon information available to us at the time they are made including the consideration of events that have occurred up until the point these Consolidated Financial Statements have been filed. These estimates and assumptions affect the reported amounts of assets, liabilities, revenues and expenses and disclosure of contingent assets and liabilities at the date of the financial statements, as well as reported amounts of revenues and expenses during the reporting period. Actual results could differ materially from these estimates.
NOTES TO CONSOLIDATED FINANCIAL STATEMENTS
Revenue Recognition and Deferred Revenue. Revenue is recognized when persuasive evidence of an arrangement exists, collectibility of arrangement consideration is reasonably assured, the arrangement fees are fixed or determinable and delivery of the product or service has been completed. A significant portion of our revenue is derived from the provision of information services to our customers on a transaction basis, in which case revenue is recognized, assuming all other revenue recognition criteria are met, when the services are provided. A smaller portion of our revenues relates to subscription-based contracts under which a customer pays a preset fee for a predetermined or unlimited number of transactions or services provided during the subscription period, generally one year. Revenue related to subscription-based contracts having a preset number of transactions is recognized as the services are provided, using an effective transaction rate as the actual transactions are completed. Any remaining revenue related to unfulfilled units is not recognized until the end of the related contract’s subscription period. Revenue related to subscription-based contracts having an unlimited volume is recognized ratably during the contract term. Revenue is recorded net of sales taxes.
If at the outset of an arrangement, we determine that collectibility is not reasonably assured, revenue is deferred until the earlier of when collectibility becomes probable or the receipt of payment. If there is uncertainty as to the customer’s acceptance of our deliverables, revenue is not recognized until the earlier of receipt of customer acceptance or expiration of the acceptance period. If at the outset of an arrangement, we determine that the arrangement fee is not fixed or determinable, revenue is deferred until the arrangement fee becomes fixed or determinable, assuming all other revenue recognition criteria have been met.
The determination of certain of our tax management services revenue requires the use of estimates, principally related to transaction volumes in instances where these volumes are reported to us by our clients on a monthly basis in arrears. In these instances, we estimate transaction volumes based on average actual volumes reported in the past. Differences between our estimates and actual final volumes reported are recorded in the period in which actual volumes are reported. We have not experienced significant variances between our estimates and actual reported volumes in the past. We monitor actual volumes to ensure that we will continue to make reasonable estimates in the future. If we determine that we are unable to make reasonable future estimates, revenue may be deferred until actual customer data is obtained. Also within our Workforce Solutions operating segment, the fees for certain of our tax credits and incentives revenue are based on a portion of the credit delivered to our clients. Revenue for these arrangements is recognized based on the achievement of milestones, upon calculation of the credit, or when the credit is utilized by our client, depending on the provisions of the client contract.
We have certain offerings that are sold as multiple element arrangements. The multiple elements may include consumer or commercial information, file updates for certain solutions, services provided by our decisioning technologies personnel, training services, statistical models and other services. To account for each of these elements separately, the delivered elements must have stand-alone value to our customer. For certain customer contracts, the total arrangement fee is allocated to the undelivered elements. If we are unable to unbundle the arrangement into separate units of accounting, we apply one of the accounting policies described above. This may lead to the arrangement consideration being recognized as the final contract element is delivered to our customer or ratably over the contract.
Many of our multiple element arrangements involve the delivery of services generated by a combination of services provided by one or more of our operating segments. No individual information service impacts the value or usage of other information services included in an arrangement and each service can be sold alone or, in most cases, purchased from another vendor without affecting the quality of use or value to the customer of the other information services included in the arrangement. Some of our products require the development of interfaces or platforms by our decisioning technologies personnel that allow our customers to interact with our proprietary information databases. These development services do not meet the requirement for having stand-alone value, thus any related development fees are deferred when billed and are recognized over the expected period that the customer will benefit from the related decisioning technologies service. Revenue from the provision of statistical models is recognized as the service is provided and accepted, assuming all other revenue recognition criteria are met. The direct costs of set up of a customer are capitalized and amortized as a cost of service during the term of the related customer contract.
We have some multiple element arrangements that include software. We recognize the elements for which we have established vendor specific objective evidence at fair value upon delivery, in accordance with the applicable guidance.
We record revenue on a net basis for those sales in which we have in substance acted as an agent or broker in the transaction.
The debt collections and recovery management revenue is calculated as a percentage of debt collected on behalf of the customer and, as such, is primarily recognized when the cash is collected assuming all other revenue recognition criteria are met.
NOTES TO CONSOLIDATED FINANCIAL STATEMENTS
Deferred revenue consists of amounts billed in excess of revenue recognized on sales of our information services relating generally to the deferral of subscription fees and arrangement consideration from elements not meeting the criteria for having stand-alone value discussed above. Deferred revenues are subsequently recognized as revenue in accordance with our revenue recognition policies.
Cost of Services. Cost of services consist primarily of (1) data acquisition and royalty fees; (2) customer service costs, which include: personnel costs to collect, maintain and update our proprietary databases, to develop and maintain software application platforms and to provide consumer and customer call center support; (3) hardware and software expense associated with transaction processing systems; (4) telecommunication and computer network expense; and (5) occupancy costs associated with facilities where these functions are performed by Equifax employees.
Selling, General and Administrative Expenses. Selling, general and administrative expenses consist primarily of personnel-related costs, restructuring costs, corporate costs, fees for professional and consulting services, advertising costs, and other costs of administration.
Advertising. Advertising costs, which are expensed as incurred, totaled $54.6 million, $63.6 million and $65.1 million during 2017, 2016 and 2015, respectively.
Stock-Based Compensation. We recognize the cost of stock-based payment transactions in the financial statements over the period services are rendered according to the fair value of the stock-based awards issued. All of our stock-based awards, which are stock options and nonvested stock, are classified as equity instruments.
Income Taxes. We account for income taxes under the liability method. We record deferred income taxes using enacted tax laws and rates for the years in which the taxes are expected to be paid. Deferred income tax assets and liabilities are recorded based on the differences between the financial reporting and income tax bases of assets and liabilities. We assess whether it is more likely than not that we will generate sufficient taxable income to realize our deferred tax assets. We record a valuation allowance, as necessary, to reduce our deferred tax assets to the amount of future tax benefit that we estimate is more likely than not to be realized.
We record tax benefits for positions that we believe are more likely than not of being sustained under audit examinations. We assess the potential outcome of such examinations to determine the adequacy of our income tax accruals. We recognize interest and penalties accrued related to unrecognized tax benefits in the provision for income taxes on our Consolidated Statements of Income. We adjust our income tax provision during the period in which we determine that the actual results of the examinations may differ from our estimates or when statutory terms expire. Changes in tax laws and rates are reflected in our income tax provision in the period in which they occur.
Earnings Per Share. Our basic earnings per share, or EPS, is calculated as net income divided by the weighted-average number of common shares outstanding during the reporting period. Diluted EPS is calculated to reflect the potential dilution that would occur if stock options or other contracts to issue common stock were exercised and resulted in additional common shares outstanding. The net income amounts used in both our basic and diluted EPS calculations are the same. A reconciliation of the weighted-average outstanding shares used in the two calculations is as follows:
|
| | | | | | | | |
| Twelve Months Ended December 31, |
| 2017 | | 2016 | | 2015 |
| (In millions) |
Weighted-average shares outstanding (basic) | 120.1 |
| | 119.3 |
| | 118.7 |
|
Effect of dilutive securities: | |
| | |
| | |
|
Stock options and restricted stock units | 1.4 |
| | 1.8 |
| | 2.2 |
|
Weighted-average shares outstanding (diluted) | 121.5 |
| | 121.1 |
| | 120.9 |
|
For the twelve months ended December 31, 2017, 2016 and 2015, 0.3 million, 0.1 million and 0.1 million stock options, respectively, were anti-dilutive and therefore excluded from this calculation.
Accelerated Share Repurchase Program. On October 24, 2014, we entered into an accelerated share repurchase (“ASR”) program to repurchase shares of our common stock under our approved share repurchase program. Under the ASR program, the number of shares to be repurchased is based generally on the daily volume weighted average price of our common stock during the term of the ASR program. On October 24, 2014, we paid $115 million in exchange for an initial delivery of 1.4
NOTES TO CONSOLIDATED FINANCIAL STATEMENTS
million shares to us, subject to a 10%, or $11.5 million, holdback. The maximum number of shares to be received or delivered under the contracts was 3.2 million.
The ASR program was accounted for as an initial treasury stock transaction and a forward stock purchase contract. The initial repurchase of shares resulted in an immediate reduction of the outstanding shares used to calculate the weighted-average common shares outstanding for basic and diluted net income per share on the effective date of the agreement. The forward stock purchase contracts are classified as equity instruments under ASC 815-40 for “Contracts in Entity's Own Equity,” and were deemed to have a fair value of zero at the effective date. On February 4, 2015, we settled the ASR and received approximately 0.02 million shares.
Cash Equivalents. We consider all highly-liquid investments with an original maturity of three months or less to be cash equivalents.
Trade Accounts Receivable and Allowance for Doubtful Accounts. We do not recognize interest income on our trade accounts receivable. Additionally, we generally do not require collateral from our customers related to our trade accounts receivable. Accounts receivable are stated at cost.
The allowance for doubtful accounts for estimated losses on trade accounts receivable is based on historical write-off experience, an analysis of the aging of outstanding receivables, customer payment patterns and the establishment of specific reserves for customers in an adverse financial condition. We reassess the adequacy of the allowance for doubtful accounts each reporting period. Increases to the allowance for doubtful accounts are recorded as bad debt expense, which are included in selling, general and administrative expenses on the accompanying Consolidated Statements of Income. Bad debt expense was $5.0 million, $2.2 million and $4.3 million during the twelve months ended December 31, 2017, 2016, and 2015, respectively.
Other Current Assets. Other current assets on our Consolidated Balance Sheets include certain current tax receivable accounts. As of December 31, 2017 and 2016 these assets were approximately $54.2 million and $10.9 million, respectively. Other current assets also includes an insurance receivable for costs incurred to date related to the cybersecurity incident that are reimbursable and probable of recovery under our insurance coverage. As of December 31, 2017, the Company has recorded a receivable of $35.0 million. For additional information, see Note 6. Other current assets also include amounts in specifically designated accounts that hold the funds that are due to customers from our debt collection and recovery management services. As of December 31, 2017 and 2016 these assets were approximately $21.4 million and $28.0 million, respectively, with fully offsetting balances in other current liabilities. These amounts are restricted as to their current use, and will be released according to the specific customer agreements. Other current assets also include foreign currency options, receivables related to life insurance policies covering certain officers of the Company, as well as deferred charges.
Long-Lived Assets. Property and equipment are stated at cost less accumulated depreciation and amortization. The cost of additions is capitalized. Property and equipment are depreciated on a straight-line basis over the assets’ estimated useful lives, which are generally three to ten years for data processing equipment and capitalized internal-use software and systems costs. Leasehold improvements are depreciated over the shorter of their estimated useful lives or lease terms that are reasonably assured. Buildings are depreciated over a forty-year period. Other fixed assets are depreciated over three to seven years. Upon sale or retirement of an asset, the related costs and accumulated depreciation are removed from the accounts and any gain or loss is recognized and included in income from operations on the Consolidated Statements of Income, with the classification of any gain or loss dependent on the characteristics of the asset sold or retired.
Certain internal-use software and system development costs are capitalized. Accordingly, the specifically identified costs incurred to develop or obtain software, which is intended for internal use, are not capitalized until the determination is made as to the availability of a technically feasible solution to solve the predefined user and operating performance requirements as established during the preliminary stage of an internal-use software development project. Costs incurred during a software development project’s preliminary stage and post-implementation stage are expensed as incurred. Application development activities that are eligible for capitalization include software design and configuration, development of interfaces, coding, testing, and installation. Capitalized internal-use software and systems costs are subsequently amortized on a straight-line basis over a three- to ten-year period after project completion and when the related software or system is ready for its intended use.
Depreciation and amortization expense related to property and equipment was $115.6 million, $88.9 million and $75.7 million during the twelve months ended December 31, 2017, 2016, and 2015, respectively.
NOTES TO CONSOLIDATED FINANCIAL STATEMENTS
Industrial Revenue Bonds. Pursuant to the terms of certain industrial revenue bonds, we have transferred title to certain of our fixed assets with total costs of $156.4 million and $117.0 million as of December 31, 2017 and 2016, respectively, to a local governmental authority in the U.S. to receive a property tax abatement related to economic development. The title to these assets will revert back to us upon retirement or cancellation of the applicable bonds. These fixed assets are still recognized in the Company’s Consolidated Balance Sheets as all risks and rewards remain with the Company.
Impairment of Long-Lived Assets. We monitor the status of our long-lived assets in order to determine if conditions exist or events and circumstances indicate that an asset group may be impaired in that its carrying amount may not be recoverable. Significant factors that are considered that could be indicative of impairment include: changes in business strategy, market conditions or the manner in which an asset group is used; underperformance relative to historical or expected future operating results; and negative industry or economic trends. If potential indicators of impairment exist, we estimate recoverability based on the asset group’s ability to generate cash flows greater than the carrying value of the asset group. We estimate the undiscounted future cash flows arising from the use and eventual disposition of the related long-lived asset group. If the carrying value of the long-lived asset group exceeds the estimated future undiscounted cash flows, an impairment loss is recorded based on the amount by which the asset group’s carrying amount exceeds its fair value. We utilize estimates of discounted future cash flows to determine the asset group’s fair value. We did not record any impairment losses of long-lived assets in any of the periods presented.
Goodwill and Indefinite-Lived Intangible Assets. Goodwill represents the cost in excess of the fair value of the net assets of acquired businesses. Goodwill is not amortized. We are required to test goodwill for impairment at the reporting unit level on an annual basis and on an interim basis if an event occurs or circumstances change that would more likely than not reduce the fair value of a reporting unit below its carrying value. We perform our annual goodwill impairment test as of September 30 each year.
Under ASC 350, we have an option to perform a “qualitative” assessment of our reporting units to determine whether further impairment testing is necessary. If an entity believes, as a result of its qualitative assessment, that it is more-likely-than-not that the fair value of a reporting unit is less than its carrying amount, the quantitative impairment test is required. Otherwise, no further testing is required. For reporting units that we determine meet these criteria, we perform a qualitative assessment. In this qualitative assessment, we consider the following items for each of the reporting units: macroeconomic conditions, industry and market conditions, overall financial performance and other entity specific events. In addition, for each of these reporting units, we assess whether the most recent fair value determination results in an amount that exceeds the carrying amount of the reporting units. Based on these assessments, we determine whether the likelihood that a current fair value determination would be less than the current carrying amount of the reporting unit is not more likely than not. If it is determined it is not more likely than not, no further testing is required. If further testing is required, we continue with the quantitative impairment test.
In analyzing goodwill for potential impairment in the quantitative impairment test, we use a combination of the income and market approaches to estimate the reporting unit’s fair value. Under the income approach, we calculate the fair value of a reporting unit based on estimated future discounted cash flows. The assumptions we use are based on what we believe a hypothetical marketplace participant would use in estimating fair value. Under the market approach, we estimate the fair value based on market multiples of revenue or earnings before interest, income taxes, depreciation and amortization for benchmark companies. If the fair value of a reporting unit exceeds its carrying value, then no further testing is required. However, if a reporting unit’s fair value were to be less than its carrying value, we would then determine the amount of the impairment charge, if any, which would be the amount that the carrying value of the reporting unit’s goodwill exceeded its implied value.
Indefinite-lived reacquired rights represent the value of rights which we had granted to various affiliate credit reporting agencies that were reacquired in the U.S. and Canada. A portion of our reacquired rights are perpetual in nature and, therefore, the useful lives are considered indefinite in accordance with the accounting guidance in place at the time of the acquisitions. Indefinite-lived intangible assets are not amortized. We are required to test indefinite-lived intangible assets for impairment annually and whenever events and circumstances indicate that there may be an impairment of the asset value. Our annual impairment test date is September 30. We perform the impairment test for our indefinite-lived intangible assets by first assessing qualitative factors to determine whether it is necessary to perform a quantitative impairment test. If the qualitative assessment indicates that we need to perform a quantitative impairment test, we compare the asset’s fair value to its carrying value. We estimate the fair value based on projected discounted future cash flows. An impairment charge is recognized if the asset’s estimated fair value is less than its carrying value.
We completed our annual impairment testing for goodwill and indefinite-lived intangible assets during the twelve months ended December 31, 2017, 2016 and 2015, and we determined that there was no impairment in any of these years.
NOTES TO CONSOLIDATED FINANCIAL STATEMENTS
Purchased Intangible Assets. Purchased intangible assets represent the estimated fair value of acquired intangible assets used in our business. Purchased data files represent the estimated fair value of consumer credit files acquired primarily through the purchase of independent credit reporting agencies in the U.S. and Canada. We expense the cost of modifying and updating credit files in the period such costs are incurred. We amortize purchased data files, which primarily consist of acquired credit files, on a straight-line basis. All of our other purchased intangible assets are also amortized on a straight-line basis.
|
| | |
Asset | | Useful Life |
| | (In years) |
Purchased data files | | 2 to 15 |
Acquired software and technology | | 1 to 10 |
Non-compete agreements | | 1 to 5 |
Proprietary database | | 6 to 10 |
Customer relationships | | 2 to 25 |
Trade names | | 1 to 15 |
Additionally, included in intangible assets are reacquired rights that represent the value of rights which we had granted to Computer Sciences Corporation that were reacquired in connection with the acquisition of CSC Credit Services in the fourth quarter of 2012 based on the accounting guidance in place at that time. These reacquired rights are being amortized over the remaining term of the affiliation agreement on a straight-line basis until August 1, 2018.
Other Assets. Other assets on our Consolidated Balance Sheets primarily represents our equity investment in unconsolidated affiliates, our cost method investment in Boa Vista Servicos (“BVS”), assets related to life insurance policies covering certain officers of the Company, and employee benefit trust assets.
Impairment of Cost Method Investment. We monitor the status of our cost method investment in order to determine if conditions exist or events and circumstances indicate that it may be impaired in that its carrying amount may exceed the fair value of the investment. Significant factors that are considered that could be indicative of an impairment include: changes in business strategy, market conditions, underperformance relative to historical or expected future operating results; and negative industry or economic trends. If potential indicators of impairment exist, we estimate the fair value of the investment using a combination of a discounted cash flow analysis and an evaluation of EBITDA and transaction multiples for comparable companies. If the carrying value of the investment exceeds the estimated fair value, an impairment loss is recorded based on the amount by which the investment’s carrying amount exceeds its fair value. There were no indicators of impairment for 2016 or 2017. We recorded an impairment of our cost method investment in 2015. See Note 2 for further discussion.
Other Current Liabilities. Other current liabilities on our Consolidated Balance Sheets consist of the offset to other current assets related to amounts in specifically designated accounts that hold the funds that are due to customers from our debt collection and recovery management services. These funds were approximately $21.4 million and $28.0 million as of December 31, 2017 and 2016, respectively. These amounts are restricted as to their current use and will be released according to the specific customer agreements. Other current liabilities also include various accrued expenses such as costs related to the cybersecurity incident as described more fully in Note 6, interest expense, accrued employee benefits, accrued taxes, accrued payroll, and accrued legal expenses.
Benefit Plans. We sponsor various pension and defined contribution plans. We also maintain certain healthcare and life insurance benefit plans for eligible retired U.S. employees. Benefits under the pension and other postretirement benefit plans are generally based on age at retirement and years of service and for some pension plans, benefits are also based on the employee’s annual earnings. The net periodic cost of our pension and other postretirement plans is determined using several actuarial assumptions, the most significant of which are the discount rate and the expected return on plan assets. The expected rate of return on plan assets is based on both our historical returns and forecasted future investment returns by asset class, as provided by our external investment advisor. Annual differences, if any, between the expected and actual returns on plan assets are included in unrecognized net actuarial gain or loss, a component of other comprehensive income. In calculating the annual amortization of the unrecognized net actuarial gain or loss, we use a market-related value of assets that smooths actual investment gains and losses on plan assets over a period up to five years. The resulting unrecognized net actuarial gain or loss amount is recognized in net periodic pension expense over the average remaining life expectancy of the participant group since almost all participants are inactive. Our Consolidated Balance Sheets reflect the funded status of the pension and other postretirement plans.
NOTES TO CONSOLIDATED FINANCIAL STATEMENTS
Foreign Currency Translation. The functional currency of each of our foreign operating subsidiaries is that subsidiary’s local currency. We translate the assets and liabilities of foreign subsidiaries at the year-end rate of exchange and revenue and expenses at the monthly average rates during the year. We record the resulting translation adjustment in other comprehensive loss, included in accumulated other comprehensive loss, a component of shareholders’ equity. We also record gains and losses resulting from the translation of intercompany balances of a long-term investment nature in foreign currency translation in other comprehensive loss and accumulated other comprehensive loss. In the years ended December 31, 2017 and 2016, we recorded $0.5 million and $8.8 million of foreign currency transaction losses, respectively. In the year ended December 31, 2015, we recorded $2.0 million of foreign currency transaction gains.
Financial Instruments. Our financial instruments consist primarily of cash and cash equivalents, accounts and notes receivable, accounts payable and short and long-term debt. The carrying amounts of these items, other than long-term debt, approximate their fair market values due to the short-term nature of these instruments. The fair value of our fixed-rate debt is determined using Level 2 inputs such as quoted market prices for publicly traded instruments, and for non-publicly traded instruments through valuation techniques depending on the specific characteristics of the debt instrument, taking into account credit risk. As of December 31, 2017 and 2016, the fair value of our long-term debt, including the current portion, based on observable inputs was $2.1 billion and $2.4 billion, respectively, compared to its carrying value of $2.1 billion and $2.4 billion, respectively.
Derivatives and Hedging Activities. Although derivative financial instruments are not utilized for speculative purposes or as the Company’s primary risk management tool, derivatives have been used as a risk management tool to hedge the Company’s exposure to changes in interest rates and foreign exchange rates. We have used interest rate swaps and interest rate lock agreements to manage interest rate risk associated with our fixed and floating-rate borrowings. Forward contracts on various foreign currencies have been used to manage the foreign currency exchange rate risk of certain firm commitments denominated in foreign currencies. We recognize all derivatives on the balance sheet at fair value. Derivative valuations reflect the value of the instrument including the value associated with any material counterparty risk.
Economic Hedges. In December 2015, in anticipation of the acquisition of Veda Group Limited ("Veda"), we purchased foreign currency options to buy Australian dollars with a weighted average strike price of $0.7225 and a notional value of 1.0 billion Australian dollars. These foreign currency options ("options") were designed to act as economic hedges for the pending Veda acquisition and were marked to market. The options had an expiry date of February 18, 2016. We recorded a mark-to-market gain on the options of $4.7 million for the year ended December 31, 2015, which was recorded in other income (expense), net. In January 2016, we purchased additional options for a notional amount of 1.0 billion Australian dollars, with a weighted average strike price of $0.7091, with expiry dates of February 11, 2016 and February 16, 2016. We settled all of the options on the respective settlement dates in February 2016. We recognized a net loss of $15.4 million related to the options in the first quarter of 2016, which was recorded in other income (expense), net.
Cash Flow Hedges. Changes in the fair value of highly effective derivatives designated as cash flow hedges are initially recorded in accumulated other comprehensive income and are reclassified into the line item in the Consolidated Statements of Income in which the hedged item is recorded in the same period the hedged item impacts earnings. Any ineffective portion is recorded in current period earnings. We did not have any unsettled cash flow hedges outstanding as of December 31, 2017, December 31, 2016 or December 31, 2015.
Fair Value Measurements. Fair value is determined based on the assumptions marketplace participants use in pricing the asset or liability. We use a three level fair value hierarchy to prioritize the inputs used in valuation techniques between observable inputs that reflect quoted prices in active markets, inputs other than quoted prices with observable market data and unobservable data (e.g., a company’s own data).
NOTES TO CONSOLIDATED FINANCIAL STATEMENTS
The following table presents assets and liabilities measured at fair value on a recurring basis:
|
| | | | | | | | | | | | | | | | | |
| | | |
| | Fair Value Measurements at Reporting Date Using: |
Description | | | Fair Value at December 31, 2017 | | Quoted Prices in Active Markets for Identical Assets (Level 1) | | Significant Other Observable Inputs (Level 2) | | Significant Unobservable Inputs (Level 3) |
| | | (In millions) |
Assets and Liabilities: | | | |
| | |
| | |
| | |
|
Deferred Compensation Plan Assets | (1) | | $ | 35.5 |
| | $ | 35.5 |
| | $ | — |
| | $ | — |
|
Deferred Compensation Plan Liability | (1) | | (35.5 | ) | | — |
| | (35.5 | ) | | — |
|
Total assets and liabilities | | | $ | — |
|
| $ | 35.5 |
|
| $ | (35.5 | ) |
| $ | — |
|
| |
(1) | We maintain deferred compensation plans that allow for certain management employees to defer the receipt of compensation (such as salary, incentive compensation and commissions) until a later date based on the terms of the plans. The liability representing benefits accrued for plan participants is valued at the quoted market prices of the participants’ investment elections. The asset consists of mutual funds reflective of the participants investment selections and is valued at daily quoted market prices. |
Assets and Liabilities Measured at Fair Value on a Nonrecurring Basis. As disclosed in Note 3, we completed various acquisitions during the years ended December 31, 2017 and 2016. The values of net assets acquired and the resulting goodwill were recorded at fair value using Level 3 inputs. The majority of the related current assets acquired and liabilities assumed were recorded at their carrying values as of the date of acquisition, as their carrying values approximated their fair values due to their short-term nature. The fair values of goodwill and definite-lived intangible assets acquired in these acquisitions were internally estimated primarily based on the income approach. The income approach estimates fair value based on the present value of the cash flows that the assets are expected to generate in the future. We developed internal estimates for the expected cash flows and discount rates in the present value calculations. The fair value of the equity method investment assets acquired were internally estimated based on the market approach. Under the market approach, we estimated fair value based on market multiples of comparable companies.
Variable Interest Entities. We hold interests in certain entities, including credit data, information solutions and debt collections and recovery management ventures, that are considered variable interest entities, or VIEs. These variable interests relate to ownership interests that require financial support for these entities. Our investments related to these VIEs totaled $13.8 million at December 31, 2017, representing our maximum exposure to loss, with the exception of the guarantees referenced in Note 6. We are not the primary beneficiary and are not required to consolidate any of these VIEs, with the exception of a debt collections and recovery management venture, for which we meet the consolidation criteria under ASC 810. In regards to that consolidated VIE, we have a 75% equity ownership interest and control of the activities that most significantly impact the VIE's economic performance. The assets and liabilities of the VIE for which we are the primary beneficiary were not significant to the Company’s consolidated financial statements, and no gain or loss was recognized because of its consolidation.
In evaluating whether we have the power to direct the activities of a VIE that most significantly impact its economic performance, we consider the purpose for which the VIE was created, the importance of each of the activities in which it is engaged and our decision-making role, if any, in those activities that significantly determine the entity's economic performance as compared to other economic interest holders. This evaluation requires consideration of all facts and circumstances relevant to decision-making that affects the entity's future performance and the exercise of professional judgment in deciding which decision-making rights are most important.
In determining whether we have the right to receive benefits or the obligation to absorb losses that could potentially be significant to the VIE, we evaluate all of our economic interests in the entity, regardless of form (debt, equity, management and servicing fees, and other contractual arrangements). This evaluation considers all relevant factors of the entity's design, including: the entity's capital structure, contractual rights to earnings (losses), subordination of our interests relative to those of other investors, contingent payments, as well as other contractual arrangements that have the potential to be economically significant. The evaluation of each of these factors in reaching a conclusion about the potential significance of our economic interests is a matter that requires the exercise of professional judgment.
Certain of our VIEs have redeemable noncontrolling interests that are subject to classification outside of permanent equity on the Company's Consolidated Balance Sheet. The redeemable noncontrolling interests are reflected using the redemption method as of the balance sheet date. Redeemable noncontrolling interest adjustments to the redemption values are
NOTES TO CONSOLIDATED FINANCIAL STATEMENTS
reflected in retained earnings. The adjustment of redemption value at the period end that reflects a redemption value in excess of fair value is included as an adjustment to net income attributable to Equifax stockholders for the purposes of the calculation of earnings per share. None of the current period adjustments reflect a redemption in excess of fair value. Additionally, due to the immaterial balance of the redeemable noncontrolling interest, we have elected to maintain the noncontrolling interest in permanent equity, rather than temporary equity, within our Consolidated Balance Sheet.
Change in Accounting Principle. In March 2016, the Financial Accounting Standards Board (“FASB”) issued ASU 2016-09 "Compensation - Stock Compensation (Topic 718)." This standard requires the recognition of the income tax effects of awards in the income statement when the awards vest or are settled, thus eliminating additional paid-in capital pools. The guidance also allows for the employer to repurchase more of an employee’s shares for tax withholding purposes without triggering liability accounting. The new guidance requires the related payments to taxing authorities to be retrospectively presented as a cash outflow from financing activities. As a result, we reclassified $27.2 million and $27.0 million of cash outflows from operating activities for the years ended 2016 and 2015, respectively, to a cash outflow from financing activities. In addition, the guidance allows for a policy election to account for forfeitures as they occur rather than on an estimated basis. The adoption of this guidance resulted in the recognition of $26.7 million and $0.22 per diluted common share, of tax benefits in our Consolidated Statement of Income for the year ended December 31, 2017. We also prospectively applied the provisions of the new guidance related to the presentation of windfall tax benefits as cash flows from operating activities which resulted in classifying $26.7 million of cash flows from financing activities to operating activities for the year ended December 31, 2017. We have elected to continue to estimate forfeitures expected to occur to determine the amount of compensation cost to be recognized each period.
In February 2018, the FASB issued ASU 2018-02, "Reclassification of Certain Tax Effects from Accumulated Other Comprehensive Income (Topic 220)." The guidance provides companies the option to eliminate the stranded tax effects associated with the change in the federal corporate income tax rate in the Tax Cuts and Jobs Act of 2017. The guidance is effective for annual periods beginning after December 31, 2018, with early adoption permitted for reporting periods for which financial statements have not been issued and can be applied retrospectively. As such, we have adopted this guidance as of December 31, 2017 resulting in the reclassification of $50.0 million from accumulated other comprehensive income to retained earnings related to the change in tax rate, as proscribed in the guidance.
Recent Accounting Pronouncements. Derivatives and Hedging. In August 2017, the FASB issued ASU 2017-12, “Targeted Improvements to Accounting for Hedging Activities (Topic 815).” The amendments in ASU 2017-12 provide targeted improvements to the accounting for hedging activities to better align an entity’s risk management activities and financial reporting for hedging relationships through changes to both the designation and measurement guidance for qualifying hedging relationships and the presentation of hedge results. The adoption of ASU 2017-12 will become effective for annual periods beginning after December 15, 2018, although early adoption is permitted. This guidance must be applied on a prospective basis. We do not expect the adoption of this ASU will have a material impact on our financial position, results of operations or cash flows.
Stock Compensation. In May 2017, the FASB issued ASU 2017-09, "Compensation - Stock Compensation (Topic 718) Scope of Modification Accounting." The amendments in ASU 2017-09 require entities to apply modification accounting in Topic 718 only when changes to the terms or conditions of a share-based payment award result in changes to fair value, vesting conditions or the classification of the award as equity or liability. The adoption of ASU 2017-09 will become effective for annual periods beginning after December 15, 2017. Based on historical modifications we do not believe the adoption of this guidance will have a material impact on our financial position, results of operations or cash flows.
Pension Costs. In March 2017, the FASB issued ASU 2017-07 "Improving the Presentation of Net Periodic Pension Cost and Net Periodic Postretirement Benefit Cost (Topic 715)." This new guidance changes how employers that sponsor defined benefit pension plans and other postretirement plans present the net periodic benefit cost in the income statement. An employer is required to report the service cost component in the same line item or items as other compensation costs arising from services rendered by the pertinent employees during the period. Other components of net benefit cost are required to be presented in the income statement separately from the service cost component and outside a subtotal of income from operations, if one is presented. The amendment also allows only the service cost component to be eligible for capitalization, when applicable. This new guidance will be effective for the Company for the first reporting period beginning after December 15, 2017, with early adoption permitted in the first quarter of 2017. The amendment will be applied retrospectively for the presentation requirements and prospectively for the capitalization of the service cost component requirements. We do not expect the adoption of this guidance to have a material impact on our financial position, results of operations or cash flows.
Goodwill. In January 2017, the FASB issued ASU 2017-04 "Simplifying the Test for Goodwill Impairment (Topic 350)." This standard eliminates Step 2 from the goodwill impairment test, instead requiring an entity to recognize a goodwill
NOTES TO CONSOLIDATED FINANCIAL STATEMENTS
impairment charge for the amount by which the goodwill carrying amount exceeds the reporting unit’s fair value. This guidance is effective for interim and annual goodwill impairment tests in fiscal years beginning after December 15, 2019 with early adoption permitted. This guidance must be applied on a prospective basis. We do not expect the adoption of this guidance to have a material impact on our financial position, results of operations or cash flows.
Definition of a business. In January 2017, the FASB issued ASU 2017-01 "Clarifying the Definition of a Business (Topic 805)." This standard provides criteria to determine when an asset acquired or group of assets acquired is not a business. When substantially all of the fair value of the gross assets acquired (or disposed of) is concentrated in a single identifiable asset or a group of similar identifiable assets, the set is not a business. This reduces the number of transactions that need to be further evaluated. The guidance is effective for interim and annual reporting periods in fiscal years beginning after December 15, 2017 with early adoption permitted. We are currently evaluating the impact of the adoption of this guidance on our financial position, results of operations and cash flows.
Statement of Cash Flows. In August 2016, the FASB issued ASU 2016-15 "Classification of Certain Cash Receipts and Cash Payments (Topic 230)." This standard provides guidance for eight targeted changes with respect to how cash receipts and cash payments are classified in the statements of cash flows, with the objective of reducing diversity in practice. The guidance is effective in 2018 with early adoption permitted. The Company elected to early adopt this accounting standard which did not have a material impact on its Consolidated Financial Statements.
Equity method investments. In March 2016, the FASB issued ASU 2016-07 "Investments - Equity Method and Joint Ventures (Topic 323)." This standard eliminates the requirement that an investor retrospectively apply equity method accounting when an investment that it had accounted for by another method initially qualifies for the equity method. The guidance requires that an equity method investor add the cost of acquiring the additional interest in the investee to the current basis of the investor’s previously held interest and adopt the equity method of accounting as of the date the investment becomes qualified for equity method accounting. The guidance is effective in 2017 with early adoption permitted. The guidance did not have a material impact on our Consolidated Financial Statements.
Leases. In February 2016, the FASB issued ASU 2016-02 “Leases (Topic 842).” This standard requires lessees to put most leases on their balance sheets but recognize expenses on their income statements in a manner similar to current lease accounting. The guidance also eliminates current real estate-specific provisions for all entities. For lessors, the guidance modifies the classification criteria and the accounting for sales-type and direct financing leases. All entities will classify leases to determine how to recognize lease-related revenue and expense. The guidance becomes effective for fiscal years and interim reporting periods beginning after December 15, 2018 with early adoption permitted and will require recognizing and measuring leases at the beginning of the earliest period presented using a modified retrospective approach. The Company is evaluating the potential effects of the adoption of this standard on its Consolidated Financial Statements.
Financial Instruments-Overall: Recognition and Measurement of Financial Assets and Financial Liabilities. In January 2016, the FASB issued ASU 2016-01 "Financial Instruments-Overall (Subtopic 825-10): Recognition and Measurement of Financial Assets and Financial Liabilities." The guidance will require equity investments in unconsolidated entities (other than those accounted for using the equity method of accounting) to be measured at fair value with changes in fair
value recognized in net income. The amendments in this update will also simplify the impairment assessment of equity investments without readily determinable fair values by requiring a qualitative assessment to identify impairment, eliminate the requirement for public business entities to disclose the method and significant assumptions used to estimate the fair value that is required to be disclosed for financial instruments measured at amortized cost on the balance sheet and require these entities to use the exit price notion when measuring fair value of financial instruments for disclosure purposes. This guidance also changes the presentation and disclosure requirements for financial instruments as well as clarifying the guidance related to valuation allowance assessments when recognizing deferred tax assets resulting from unrealized losses on available-for-sale debt securities. The guidance becomes effective for fiscal years and interim reporting periods beginning after December 15, 2018 with early adoption permitted for financial statements of fiscal years and interim periods that have not been issued. The guidance will impact our cost method investment in BVS, more fully described in Note 2, which we have concluded does not have a readily determinable fair value. This investment will be adjusted through net income prospectively, upon adoption of the new guidance, for any observable price changes for an identical or similar investment of the same issuer or for any impairments.
Revenue Recognition. In May 2014, the FASB issued ASU No. 2014-9, "Revenue from Contracts with Customers." ASU 2014-9 is a comprehensive new revenue recognition model that requires a company to recognize revenue to depict the transfer of goods or services to a customer at an amount that reflects the consideration it expects to receive in exchange for those goods or services. ASU 2014-9 also requires additional disclosure about the nature, amount, timing and uncertainty of revenue and cash flows arising from customer contracts, including significant judgments and changes in judgments and assets
NOTES TO CONSOLIDATED FINANCIAL STATEMENTS
recognized from costs incurred to obtain or fulfill a contract. ASU 2014-9 was originally effective for annual reporting periods, and interim periods within that period, beginning after December 15, 2016 and early adoption was not permitted. On July 9, 2015, the FASB voted to defer the effective date by one year to December 15, 2017 for interim and annual reporting periods beginning after that date and permitted early adoption of the standard, but not before the original effective date of December 15, 2016. Companies may use either a full retrospective or a modified retrospective approach to adopt ASU 2014-9.
Based on our assessment, we will adopt the standard using the modified retrospective method in the first quarter of fiscal 2018. The new standard will impact our contracts that have a known quantity over a defined term with price increases or decreases over the contract life. Under the current standard, the revenue related to these contracts are limited by billings in a period. Under the new standard the total contract value will be recognized ratably over the defined term or by using a transactional standalone selling price resulting in the creation of a contract asset or contract liability as transactions are delivered. Based upon analysis performed, we have determined that the revenue recognition aspects of the new standard will not materially affect our consolidated revenue, consolidated net earnings, financial position, or cash flows based on the application of the guidance to our contracts with customers. Additionally, the new guidance specifies that all incremental costs of obtaining a contract and the direct costs of fulfilling a contract with customers should be deferred and recognized over the contract period or expected customer life. Based on our assessment, there will not be a significant change in our cost capitalization practices resulting from the application of the guidance. Finally, we have assessed the additional disclosure requirements related to the new standard and note that there will be changes in the presentation of our revenue recognition disclosures beginning in the first quarter of 2018. These changes include the presentation of disaggregated revenue, discussion of revenue recognition policies, the disclosure of contract asset and contract liability accounts as well as disclosures around the remaining performance obligations for those contracts impacted by the new standard.
2. COST METHOD INVESTMENT
We hold a 15% equity interest in BVS, which is the second largest consumer and commercial credit information company in Brazil. This investment is recorded in other assets, net, on the Consolidated Balance Sheets and is accounted for using the cost method. As of December 31, 2012, our investment in BVS was valued at 130 million Brazilian Reais, which was the same as the initial fair value. The initial fair value was determined by a third-party using income, market and transaction approaches. During 2016, BVS issued new shares through which our ownership interest was diluted by approximately 1%. This dilution did not result in an impairment of our investment.
During the second quarter of 2015, we received updated management financial projections, which, along with continued weakness in the Brazilian consumer and small commercial credit markets were considered indicators of impairment. Management of Equifax prepared an analysis to estimate the fair value of our investment at June 30, 2015 and estimated that value to be 44 million Brazilian Reais ($14.1 million). As a result, we decreased the carrying value of our investment and recorded a loss at that time of 46 million Brazilian Reais ($14.8 million) which is included in other income (expense), net, in the Consolidated Statements of Income. Additionally, the carrying value has decreased by $37.0 million related to the foreign exchange impact since 2011, which is included in the foreign currency translation adjustments in accumulated other comprehensive income. As of December 31, 2017, our investment in BVS, recorded at 44 million Brazilian Reais ($13.5 million), approximated the fair value.
3. ACQUISITIONS AND INVESTMENTS
2017 Acquisitions and Investments. On August 10, 2017, the Company completed the acquisition of 100% of the outstanding stock of ID Watchdog, Inc., an identity theft protection and resolution company providing solutions to the employee benefits marketplace. On November 15, 2017, the Company completed the acquisition of 100% of the outstanding stock of Mercury Group of Companies Pty Ltd ("Mercury"), an Australian-owned workforce management company. The primary areas of the purchase price that are not yet finalized are related to income taxes and working capital. Accordingly, adjustments may be made to the values of the assets acquired and liabilities assumed as additional information is obtained about the facts and circumstances that existed at the valuation date.
2016 Acquisitions and Investments. On February 24, 2016, the Company completed the acquisition of 100% of the ordinary voting shares of Veda for cash consideration of approximately $1.7 billion (2.4 billion Australian dollars) and debt assumed of approximately $189.5 million (261.9 million Australian dollars). The acquisition provides a strong platform for Equifax to offer data and analytic services and further broaden the Company's geographic footprint. Veda stockholders received 2.825 Australian dollars in cash for each share of Veda common stock they owned. The Company financed the transaction with $1.7 billion of debt, consisting of commercial paper, an $800.0 million 364-Day revolving credit facility (the "364-Day Revolver"), and an $800.0 million three-year delayed draw term loan facility (the "Term Loan"). Refer to Note 5 for further discussion on debt. On August 23, 2016, the Company completed the acquisition of 100% of the assets and certain
NOTES TO CONSOLIDATED FINANCIAL STATEMENTS
liabilities of unemployment tax and claims management specialists Barnett & Associates ("Barnett"), as well as the verifications business, Computersoft, LLC ("Computersoft"). We have completed the allocation of the Veda, Barnett and Computersoft purchase prices.
Purchase Price Allocation. The following table summarizes the estimated fair value of the net assets acquired and the liabilities assumed at the acquisition dates during 2017 and 2016.
|
| | | | | | | |
| December 31, |
| 2017 | | 2016 |
| (In millions) |
Cash | $ | 4.3 |
| | $ | 23.7 |
|
Accounts receivable and other current assets | 3.2 |
| | 39.6 |
|
Other assets | 0.4 |
| | 42.0 |
|
Identifiable intangible assets (1) | 51.0 |
| | 681.0 |
|
Goodwill (2) | 92.4 |
| | 1,456.3 |
|
Total assets acquired | 151.3 |
| | 2,242.6 |
|
Debt(3) | — |
| | (189.5 | ) |
Other current liabilities | (5.1 | ) | | (40.2 | ) |
Other liabilities | (10.9 | ) | | (178.1 | ) |
Non-controlling interest | — |
| | (11.7 | ) |
Net assets acquired | $ | 135.3 |
| | $ | 1,823.1 |
|
| |
(1) | Identifiable intangible assets are further disaggregated in the following table. |
| |
(2) | The goodwill related to ID Watchdog, Inc. and Mercury is included in the GCS and International operating segments, respectively, and is not deductible for tax purposes. The goodwill related to Veda is included in the International operating segment and is not deductible for tax purposes. The goodwill related to the Barnett and Computersoft acquisition is included in the Workforce Solutions operating segment and is deductible for tax purposes. |
| |
(3) | The Veda debt of $191 million was paid in full on March 10, 2016. |
The primary reasons the purchase price of these acquisitions exceeded the fair value of the net assets acquired, which resulted in the recognition of goodwill, were expanded growth opportunities from new or enhanced product offerings and geographies, cost savings from the elimination of duplicative activities, and the acquisition of an assembled workforce that are not recognized as assets apart from goodwill.
|
| | | | | | | | | | | | |
| | December 31, |
| | 2017 | | 2016 |
Intangible asset category | | Fair value | | Weighted-average useful life | | Fair value | | Weighted-average useful life |
| | (in millions) | | (in years) | | (in millions) | | (in years) |
Customer relationships | | $ | 42.7 |
| | 10.2 | | $ | 171.3 |
| | 14.9 |
Acquired software and technology | | 6.5 |
| | 6.5 | | 106.3 |
| | 4.2 |
Purchased data files | | — |
| | n/a | | 387.5 |
| | 14.8 |
Non-compete agreements | | — |
| | n/a | | 5.4 |
| | 2.1 |
Trade names and other intangible assets | | 1.8 |
| | 2.9 | | 10.5 |
| | 1.0 |
Total acquired intangibles | | $ | 51.0 |
| | 9.5 | | $ | 681.0 |
| | 12.9 |
Pro Forma Financial Information. The following table presents unaudited consolidated pro forma information as if our acquisition of Veda had occurred at the beginning of the earliest period presented. The pro forma amounts may not be necessarily indicative of the operating revenues and results of operations had the acquisition actually taken place at the beginning of the earliest period presented. Furthermore, the pro forma information may not be indicative of future performance.
NOTES TO CONSOLIDATED FINANCIAL STATEMENTS
|
| | | | | | | | | | | | | | | |
| Twelve months ended December 31, |
| 2016 | | 2015 |
| As Reported | | Pro Forma | | As Reported | | Pro Forma |
| (In millions, except per share data) |
Operating revenues | $ | 3,144.9 |
| | $ | 3,180.9 |
| | $ | 2,663.6 |
| | $ | 2,929.0 |
|
Net income attributable to Equifax | $ | 488.8 |
| | $ | 488.1 |
| | $ | 429.1 |
| | $ | 429.9 |
|
Net income per share (basic) | $ | 4.10 |
| | $ | 4.09 |
| | $ | 3.61 |
| | $ | 3.62 |
|
Net income per share (diluted) | $ | 4.04 |
| | $ | 4.03 |
| | $ | 3.55 |
| | $ | 3.56 |
|
The unaudited pro forma financial information presented in the table above has been adjusted to give effect to adjustments that are (1) directly related to the business combination; (2) factually supportable; and (3) expected to have a continuing impact. These adjustments include, but are not limited to, the application of our accounting policies and depreciation and amortization related to fair value adjustments and intangible assets.
4. GOODWILL AND OTHER INTANGIBLE ASSETS
Goodwill. Goodwill represents the cost in excess of the fair value of the net assets acquired in a business combination. As discussed in Note 1, goodwill is tested for impairment at the reporting unit level on an annual basis and on an interim basis if an event occurs or circumstances change that would more likely than not reduce the fair value of a reporting unit below its carrying value. We perform our annual goodwill impairment tests as of September 30 each year. The fair value estimates for our reporting units were determined using a combination of the income and market approaches in accordance with the Company’s methodology. Our annual impairment tests as of September 30, 2017, 2016 and 2015 resulted in no impairment of goodwill.
In the fourth quarter of 2017, we acquired Mercury, for which the acquired goodwill has been allocated to the Asia Pacific reporting unit within the International operating segment. In the third quarter of 2017, we acquired ID Watchdog, Inc., for which the acquired goodwill has been allocated to the Global Consumer Solutions reporting unit and operating segment.
In the first quarter of 2016, we acquired Veda, which operates primarily in Australia and New Zealand. We have included Veda's operations within a newly-created Asia Pacific reporting unit within the International operating segment. Additionally, we moved the TDX Australia and India operations that were included in our Europe reporting unit to the Asia Pacific reporting unit to align with how we manage our business. Our financial results for the year ended December 31, 2015, reflect our new organizational structure. Lastly in 2016, we have renamed our Personal Solutions operating segment Global Consumer Solutions.
To reflect this new organizational structure, we reallocated goodwill from the Europe reporting unit to the Asia Pacific reporting unit based on the relative fair values of the respective portions of Europe. A change in reporting units requires that goodwill be tested for impairment. During 2016, we performed goodwill impairment tests prior to and following the reallocation of goodwill, which resulted in no impairment.
In the third quarter of 2016, we acquired Barnett and Computersoft for which the acquired goodwill has been allocated between the Verification Services and Employer Services reporting units within the Workforce Solutions operating segment.
In 2015, the personal solutions business in the United Kingdom was consolidated into the North America Global Consumer Solutions operating segment, which was reorganized into the Global Consumer Solutions operating segment. Additionally in 2015, the direct to consumer reseller businesses in the U.S., Canada, and the United Kingdom were also consolidated into the Global Consumer Solutions operating segment. These changes were driven by an enterprise wide strategy to maximize the penetration of our products and services in our targeted markets. We determined that market focus and operating efficiency could be further improved by reorganizing and consolidating the United States, Canada and the United Kingdom Global Consumer Solutions and direct to consumer reseller operating activities into one segment, Global Consumer Solutions.
To reflect this new organizational structure, we reallocated goodwill from the USIS, Canada, and Europe reporting units to the Global Consumer Solutions reporting unit based on the relative fair values of the respective portions of USIS, Canada, and Europe. A change in reporting units requires that goodwill be tested for impairment. During 2015, we performed
NOTES TO CONSOLIDATED FINANCIAL STATEMENTS
goodwill impairment tests prior to and following the reallocation of goodwill for USIS, Canada, Europe and Global Consumer Solutions, which resulted in no impairment.
Changes in the amount of goodwill for the twelve months ended December 31, 2017 and 2016, are as follows:
|
| | | | | | | | | | | | | | | | | | | |
| U.S.
Information
Solutions | | International | | Workforce Solutions | | Global Consumer Solutions | | Total |
| (In millions) |
Balance, December 31, 2015 | $ | 1,071.3 |
| | $ | 441.5 |
| | $ | 907.6 |
| | $ | 150.6 |
| | $ | 2,571.0 |
|
Acquisitions | — |
| | 1,411.6 |
| | 44.7 |
| | — |
| | 1,456.3 |
|
Adjustments to initial purchase price allocation | — |
| | (6.2 | ) | | (0.2 | ) | | — |
| | (6.4 | ) |
Foreign currency translation | — |
| | (32.3 | ) | | — |
| | (14.3 | ) | | (46.6 | ) |
Balance, December 31, 2016 | 1,071.3 |
| | 1,814.6 |
| | 952.1 |
| | 136.3 |
| | 3,974.3 |
|
Acquisitions | — |
| | 43.9 |
| | — |
| | 48.5 |
| | 92.4 |
|
Adjustments to initial purchase price allocation | — |
| | 1.0 |
| | — |
| | — |
| | 1.0 |
|
Foreign currency translation | — |
| | 109.9 |
| | — |
| | 6.4 |
| | 116.3 |
|
Balance, December 31, 2017 | $ | 1,071.3 |
| | $ | 1,969.4 |
| | $ | 952.1 |
| | $ | 191.2 |
| | $ | 4,184.0 |
|
Indefinite-Lived Intangible Assets. Indefinite-lived intangible assets consist of indefinite-lived reacquired rights representing the value of rights which we had granted to various affiliate credit reporting agencies that were reacquired in the U.S. and Canada. At the time we acquired these agreements, they were considered perpetual in nature under the accounting guidance in place at that time and, therefore, the useful lives are considered indefinite. Indefinite-lived intangible assets are not amortized. We are required to test indefinite-lived intangible assets for impairment annually and whenever events or circumstances indicate that there may be an impairment of the asset value. We perform our annual indefinite-lived intangible asset impairment test as of September 30. Our 2017 annual impairment test completed during the third quarter of 2017 resulted in no impairment of indefinite-lived intangible assets.
|
| | | |
| Amount |
| (In millions) |
Balance, December 31, 2015 | $ | 94.7 |
|
Foreign currency translation | 0.1 |
|
Balance, December 31, 2016 | 94.8 |
|
Foreign currency translation | 0.2 |
|
Balance, December 31, 2017 | $ | 95.0 |
|
Purchased Intangible Assets. Purchased intangible assets, net, recorded on our Consolidated Balance Sheets at December 31, 2017 and 2016, are as follows:
|
| | | | | | | | | | | | | | | | | | | | | | | |
| December 31, 2017 | | December 31, 2016 |
| Gross | | Accumulated
Amortization | | Net | | Gross | | Accumulated
Amortization | | Net |
Definite-lived intangible assets: | (In millions) |
Purchased data files | $ | 955.7 |
| | $ | (262.2 | ) | | $ | 693.5 |
| | $ | 1,012.7 |
| | $ | (276.0 | ) | | $ | 736.7 |
|
Acquired software and technology | 142.3 |
| | (66.6 | ) | | 75.7 |
| | 131.5 |
| | (36.1 | ) | | 95.4 |
|
Customer relationships | 772.4 |
| | (326.7 | ) | | 445.7 |
| | 712.7 |
| | (273.0 | ) | | 439.7 |
|
Reacquired rights | 73.3 |
| | (65.6 | ) | | 7.7 |
| | 73.3 |
| | (52.5 | ) | | 20.8 |
|
Proprietary database | 22.1 |
| | (8.7 | ) | | 13.4 |
| | 21.5 |
| | (6.7 | ) | | 14.8 |
|
Non-compete agreements | 14.1 |
| | (12.7 | ) | | 1.4 |
| | 26.8 |
| | (22.2 | ) | | 4.6 |
|
Trade names and other intangible assets | 20.2 |
| | (10.6 | ) | | 9.6 |
| | 54.1 |
| | (42.3 | ) | | 11.8 |
|
Total definite-lived intangible assets | $ | 2,000.1 |
| | $ | (753.1 | ) | | $ | 1,247.0 |
| | $ | 2,032.6 |
| | $ | (708.8 | ) | | $ | 1,323.8 |
|
NOTES TO CONSOLIDATED FINANCIAL STATEMENTS
Amortization expense related to purchased intangible assets was $172.2 million, $176.5 million, and $122.3 million during the twelve months ended December 31, 2017, 2016, and 2015, respectively.
Estimated future amortization expense related to definite-lived purchased intangible assets at December 31, 2017 is as follows:
|
| | | | |
Years ending December 31, | | Amount |
| | (In millions) |
2018 | | $ | 149.7 |
|
2019 | | 130.1 |
|
2020 | | 123.6 |
|
2021 | | 105.9 |
|
2022 | | 99.9 |
|
Thereafter | | 637.8 |
|
| | $ | 1,247.0 |
|
5. DEBT
Debt outstanding at December 31, 2017 and 2016 was as follows:
|
| | | | | | | |
| December 31, |
| 2017 | | 2016 |
| (In millions) |
|
| |
Commercial paper ("CP") | $ | 562.6 |
|
| $ | 310.3 |
|
Revolver | 100.0 |
|
| — |
|
Notes, 6.30%, due July 2017 | — |
|
| 272.5 |
|
Term loan, due Nov 2018 | 400.0 |
|
| 450.0 |
|
Notes, 2.30%, due June 2021 | 500.0 |
|
| 500.0 |
|
Notes, 3.30%, due Dec 2022 | 500.0 |
|
| 500.0 |
|
Notes, 3.25%, due June 2026 | 275.0 |
|
| 275.0 |
|
Debentures, 6.90%, due July 2028 | 125.0 |
|
| 125.0 |
|
Notes, 7.00%, due July 2037 | 250.0 |
|
| 250.0 |
|
Other | 2.7 |
|
| 2.6 |
|
Total debt | 2,715.3 |
|
| 2,685.4 |
|
Less short-term debt and current maturities | (965.3 | ) |
| (585.4 | ) |
Less unamortized discounts and debt issuance costs | (11.0 | ) |
| (13.2 | ) |
Total long-term debt, net of discount | $ | 1,739.0 |
|
| $ | 2,086.8 |
|
Scheduled future maturities of debt at December 31, 2017, are as follows:
|
| | | | |
Years ending December 31, | | Amount |
| | (In millions) |
2018 | | $ | 965.3 |
|
2019 | | — |
|
2020 | | 100.0 |
|
2021 | | 500.0 |
|
2022 | | 500.0 |
|
Thereafter | | 650.0 |
|
Total debt | | $ | 2,715.3 |
|
Senior Credit Facilities. We are party to a $900.0 million five-year unsecured revolving credit facility (the "Revolver") and the previously described Term Loan (the Revolver and Term Loan collectively, the "Senior Credit Facilities"), with a group of financial institutions. The Revolver also has an accordion feature that allows us to request an increase in the total commitment to $1.2 billion. Borrowings may be used for general corporate purposes, including working capital, capital expenditures, acquisitions and share repurchase programs. The Revolver and the Term Loan are scheduled to expire on November 21, 2020 and November 21, 2018, respectively. The Revolver includes an option to request a maximum of two one-year extensions of the maturity date. Availability of the Senior Credit Facility for borrowings is reduced by the outstanding principal balance of our commercial paper notes and by any letters of credit issued under the facility. As of December 31, 2017, there were $100 million in outstanding borrowings on our Revolver.
We were also a party to an $800.0 million 364-Day revolving credit facility. On May 16, 2016 we repaid all outstanding borrowings of $475.0 million and terminated the 364-Day Revolver using a portion of the net proceeds from the issuance of the senior notes discussed below.
Under the Senior Credit Facilities, the Company must comply with various financial and non-financial covenants. The financial covenants require the Company to maintain a maximum leverage ratio, defined as consolidated funded debt divided by consolidated EBITDA (as set forth in the Senior Credit Facilities) for the preceding four quarters, of not more than 3.5 to 1.0. The Company may, subject to the terms of the Senior Credit Facilities, increase the covenant by 0.5 (i.e. to 4.0 to 1.0) for a four consecutive fiscal quarter period following a material acquisition. As permitted under the terms of the Senior Credit Facilities, we made the election to increase the covenant to 4.0 to 1.0, effective for four consecutive quarters, beginning with the first quarter of 2016 and continuing through the fourth quarter of 2016. Compliance with this financial covenant is tested quarterly. The non-financial covenants include limitations on liens, subsidiary debt, mergers, liquidations, asset dispositions and acquisitions. As of December 31, 2017, we were in compliance with our covenants under the Senior Credit Facilities. Our borrowings under these facilities, which have not been guaranteed by any of our subsidiaries, are unsecured and will rank on parity in right of payment with all of our other unsecured and unsubordinated indebtedness from time to time outstanding.
At December 31, 2017, interest was payable on borrowings under the Senior Credit Facilities at the base rate or London Interbank Offered Rate, or LIBOR, plus a specified margin. The specified margin and the annual unused fee, which we pay on the unused portion of the Revolver, are subject to adjustment based on our debt ratings. As of December 31, 2017, we had $15.5 million of letters of credit outstanding under our Senior Credit Facility. As of December 31, 2017, $221.9 million was available for borrowings under the Senior Credit Facilities and there were $100.0 million in outstanding borrowings under the Revolver.
Commercial Paper Program. The Company's $900.0 million CP program has been established through the private placement of CP notes from time to time, in which borrowings bear interest at either a variable rate (based on LIBOR or other benchmarks) or a fixed rate, with the applicable rate and margin. Maturities of CP can range from overnight to 397 days. Because the CP program is backstopped by the Revolver, the amount of CP which may be issued under the program is reduced by the outstanding face amount of any letters of credit issued under the facility and, pursuant to our existing Board of Directors authorization, by the outstanding borrowings under our Senior Credit Facility. At December 31, 2017, there were $562.6 million CP notes outstanding, all with maturities of less than 90 days.
Receivables Funding Facility. In the fourth quarter of 2017, Equifax entered into a $225.0 million, 2-year receivables funding facility (the "Receivables Facility"), which matures in 2019. Under the Receivables Facility, Equifax and certain of its U.S. subsidiaries sell the eligible third-party receivables of its U.S. based business, to Equifax Receivables Funding LLC, a consolidated, wholly-owned, bankruptcy-remote subsidiary that may subsequently transfer, without recourse, an undivided interest in these accounts receivable to investors. The investors have no recourse to the Company’s other assets except for customary repurchase, warranty and indemnity claims. Creditors of Equifax do not have recourse to the assets of Equifax Receivables Funding LLC. The Receivables Facility contains standard representations, warranties and covenants made by Equifax and its U.S. subsidiaries in connection with the sale of the receivables, and any repurchase, warranty or indemnity obligations of the U.S. subsidiaries in connection with the sale of the receivables (but no obligations of Equifax Receivables Funding LLC) are guaranteed by Equifax.
There were no borrowings under the Receivables Facility at December 31, 2017. The Receivables Facility was supported by $204.3 million of accounts receivable as collateral at December 31, 2017 which, as a retained interest, is included in accounts receivable, net in our Consolidated Balance Sheets.
The outstanding amount the Company is allowed to maintain under the Receivables Facility, with a maximum of $225 million, may fluctuate based on the availability of eligible receivables and is directly affected by business volumes and credit
NOTES TO CONSOLIDATED FINANCIAL STATEMENTS
risks, including receivables payment quality measures such as default and dilution ratios. If default or dilution ratios increase one percent, the allowable outstanding amount under the Receivables Facility would not materially change.
Interest is payable on borrowings under the Receivables Facility at the base rate or LIBOR plus a specified margin. The specified margin and the monthly unused fee, which we pay on the unused portion of the Receivables Facility, are subject to adjustment based on our debt ratings. The costs of the Receivables Facility are included in interest expense and were not material in 2017.
2.3% and 3.25% Senior Notes. On May 12, 2016, we issued $500.0 million principal amount of 2.3%, five-year senior notes and $275.0 million principal amount of 3.25%, ten-year senior notes in an underwritten public offering. Interest is payable semi-annually in arrears on June 1 and December 1 of each year, beginning on December 1, 2016. The net proceeds of the sale of the notes were used to repay borrowings under our 364-Day Revolver and a portion of the borrowings under our commercial paper program incurred to finance the acquisition of Veda. We must comply with various non-financial covenants, including certain limitations on mortgages, liens and sale-leaseback transactions, as well as mergers and sales of substantially all of our assets. The senior notes are unsecured and rank equally with all of our other unsecured and unsubordinated indebtedness.
6.3% and 7.0% Senior Notes. On June 28, 2007, we issued $300.0 million principal amount of 6.3%, ten-year senior notes and $250.0 million principal amount of 7.0%, thirty-year senior notes in underwritten public offerings. Interest is payable semi-annually in arrears on January 1 and July 1 of each year. The net proceeds of the financing were used to repay short-term indebtedness, a substantial portion of which was incurred in connection with our acquisition of TALX. We must comply with various non-financial covenants, including certain limitations on liens, additional debt and mortgages, mergers, asset dispositions and sale-leaseback arrangements. The senior notes are unsecured and rank equally with all of our other unsecured and unsubordinated indebtedness. On July 3, 2017 we repaid our July 2017 Senior Notes using the proceeds of commercial paper.
3.3% Senior Notes. On December 17, 2012, we issued $500.0 million principal amount of 3.3%, ten-year senior notes in an underwritten public offering. Interest is payable semi-annually in arrears on December 15 and June 15 of each year. The net proceeds of the sale of the notes were used to partially finance the acquisition of CSC Credit Services in December 2012. We must comply with various non-financial covenants, including certain limitations on liens, additional debt and mortgages, mergers, asset dispositions and sale-leaseback arrangements. The senior notes are unsecured and rank equally with all of our other unsecured and unsubordinated indebtedness.
6.9% Debentures. We have $125.0 million of debentures outstanding with a maturity date of 2028. The debentures are unsecured and rank equally with all of our other unsecured and unsubordinated indebtedness.
Cash paid for interest was $96.9 million, $85.0 million and $61.6 million during the twelve months ended December 31, 2017, 2016 and 2015, respectively.
6. COMMITMENTS AND CONTINGENCIES
Cybersecurity Incident. In fiscal 2017, we experienced a cybersecurity incident following a criminal attack on our systems that involved the theft of certain personally identifiable information of U.S., Canadian and U.K. consumers. Criminals exploited a U.S. website application vulnerability to gain unauthorized access to our network. Based on our forensic investigation, the unauthorized access occurred from mid-May through July 2017. The information accessed primarily includes names, Social Security numbers, birth dates, addresses and, in some instances, driver’s license numbers. In addition, credit card numbers for approximately 209,000 U.S. and Canadian consumers, and certain dispute documents with personal identifying information for approximately 182,000 U.S. consumers, were accessed. The investigation determined that personal information of approximately 19,000 Canadian consumers was impacted and approximately 860,000 potentially affected U.K. consumers were contacted regarding access to personal information.
As a result of an ongoing analysis of data stolen in the 2017 cybersecurity incident, the Company recently announced that it has identified approximately 2.4 million U.S. consumers whose name and partial driver's license information were stolen, but who were not in the affected population of approximately 145.5 million consumers previously identified by the Company in 2017. The Company is in the process of notifying these additional consumers.
Upon discovery of the unauthorized access, we acted immediately to stop the intrusion and promptly engaged a leading, independent cybersecurity firm to conduct a comprehensive forensic investigation to determine the scope of the intrusion, including the specific data potentially impacted. The forensic investigation of the consumers potentially impacted by
NOTES TO CONSOLIDATED FINANCIAL STATEMENTS
the cybersecurity incident was completed in the fourth quarter of 2017. We also reported the criminal access to law enforcement and continue to cooperate with law enforcement in connection with the criminal investigation into the actors responsible for the cybersecurity incident.
Expenses Incurred. Through December 31, 2017, the Company recorded $113.3 million of pretax expenses related to the cybersecurity incident. We have included $14.2 million of these expenses in Cost of services and $99.1 million in Selling, general and administrative expenses in the accompanying Consolidated Statements of Income for the year ended December 31, 2017. Expenses include costs to investigate and remediate the cybersecurity incident and legal and other professional services related thereto, all of which were expensed as incurred.
Product Liability. Additionally, as a result of the cybersecurity incident, we offered free credit file monitoring and identity theft protection to all U.S. consumers. We have recorded the expenses necessary to provide this service to those who signed up. We have recorded $50.7 million through December 31, 2017 included in Selling, general and administrative expenses in the accompanying Consolidated Statements of Income.
Litigation, Claims and Government Investigations. As a result of the cybersecurity incident, we are subject to a significant number of proceedings and investigations. Following the 2017 cybersecurity incident, hundreds of class actions were filed by consumers against us in federal, state and Canadian courts relating to the cybersecurity incident. The plaintiffs in these cases, who purport to represent various classes of consumers, generally claim to have been harmed by alleged actions and/or omissions by Equifax in connection with the cybersecurity incident and assert a variety of common law and statutory claims seeking monetary damages, injunctive relief and other related relief. In addition, certain class actions have been filed by financial institutions who allege their businesses have been placed at risk due to the cybersecurity incident and generally assert various common law claims such as claims for negligence and breach of contract, as well as, in some cases, statutory claims. The financial institutions class actions seek compensatory damages and other related relief. Furthermore, a lawsuit has been filed by the City of Chicago with respect to the cybersecurity incident alleging violations of state laws and local ordinances governing protection of personal data, consumer fraud and breach notice requirements and business practices. Beginning on December 6, 2017 and pursuant to multiple subsequent orders, the U.S. Judicial Panel on Multidistrict Litigation ordered the consolidation and transfer for pre-trial proceedings with respect to the U.S. cases pending in federal court discussed above to the Northern District of Georgia as the single U.S. District Court for centralized proceedings. Based on this order, consolidated pre-trial hearings with respect to U.S. consumer and financial institution federal class actions related to the cybersecurity incident have begun in the Northern District of Georgia. In addition to these federal court proceedings, four putative class actions arising from the cybersecurity incident have been filed in the Fulton County Superior Court in Georgia. We have also appeared or notified the appropriate parties of representation in the Canadian class actions, but such actions are all at the preliminary stages. In addition, a civil enforcement action has been filed by the Attorney General of Massachusetts and a lawsuit has been filed by the City of San Francisco, each of which are in the initial pre-trial stages. We dispute the allegations in the complaints described above and intend to defend against such claims.
In addition, we continue to cooperate with federal, state, city and foreign governmental agencies and officials investigating or otherwise seeking information and/or documents, including through Civil Investigative Demands, regarding the cybersecurity incident and related matters, including 49 state Attorneys General offices, as well as the District of Columbia, the Federal Trade Commission, the Consumer Finance Protection Bureau, the U.S. Securities and Exchange Commission (“SEC”), the U.S. Department of Justice, the New York Department of Financial Services, the New York Department of State - Division of Consumer Protection, other U.S. state regulators, including state banking regulators, the Financial Industry Regulatory Authority, certain Congressional committees of both the U.S. Senate and House of Representatives, the United Kingdom’s Financial Conduct Authority (“FCA”), the Information Commissioner’s Office in the United Kingdom and the Office of the Privacy Commissioner of Canada. Although we are actively cooperating with these investigations and inquiries, an adverse outcome to any such investigations and inquiries could subject us to fines or other obligations, which may have an adverse effect on how we operate our business or our results of operations. In addition, we continue to cooperate with the SEC and the U.S. Attorney’s Office for the Northern District of Georgia regarding investigations into the trading activities by certain of our employees in relation to the cybersecurity incident.
TransUnion Litigation. On November 27, 2017, Trans Union LLC and TransUnion Interactive, Inc. (collectively, “TransUnion”) filed a lawsuit in the U.S. District Court for the Northern District of Illinois against Equifax Information Services LLC, Equifax Inc., and Equifax Consumer Services LLC f/k/a Equifax Consumer Services, Inc. In its lawsuit, TransUnion asserts claims for declaratory relief, breach of contract, and anticipatory repudiation of contract based on our Reciprocal Data Supply Agreement (the “Agreement”), which sets forth the pricing terms for credit monitoring supplied by the parties to each other. TransUnion seeks a declaration regarding its contractual rights under the Agreement and monetary damages. On January 26, 2018, we moved to dismiss TransUnion’s claims, and discovery in the case has been stayed until a ruling on that motion is issued. We dispute the allegations by TransUnion and intend to defend against its claims.
NOTES TO CONSOLIDATED FINANCIAL STATEMENTS
Securities Class Action Litigation. A consolidated putative class action lawsuit alleging violations of the federal securities laws in connection with statements regarding our cybersecurity systems and controls is pending against us and certain of our current and former officers and directors in the Northern District of Georgia. The complaints seek certification of a class of all persons who purchased or otherwise acquired Equifax securities during a set period of time and unspecified monetary damages, costs and attorneys’ fees. We dispute the allegations in these complaints and intend to defend against the claims.
Shareholder Derivative Litigation. Four putative shareholder derivative lawsuits have been commenced in the Northern District of Georgia naming certain of our current and former officers and directors as defendants and naming us as a nominal defendant. Among other things, the complaints allege claims for breaches of fiduciary duties, unjust enrichment, corporate waste, and insider selling by certain defendants. Three of the complaints also allege claims for violations of certain federal securities laws. The Complaints seek unspecified damages on behalf of the Company, plus certain equitable relief. Certain plaintiffs have filed motions seeking consolidation of the actions and appointment as lead plaintiffs. We have appointed a committee of independent directors empowered to evaluate and respond in our best interests to the claims and related litigation demands.
While we believe it is reasonably possible that we will incur losses associated with these proceedings and investigations, it is not possible to estimate the amount of loss or range of possible loss that might result from adverse judgments, settlements, penalties or other resolution of such proceedings and investigations based on the early stage of these proceedings and investigations, that alleged damages have not been specified, the uncertainty as to the certification of a class or classes and the size of any certified class, as applicable, and the lack of resolution on significant factual and legal issues. The Company will continue to evaluate information as it becomes known and will record an estimate for losses at the time or times when it is both probable that a loss has been incurred and the amount of the loss is reasonably estimable. The Company believes that the ultimate amount paid on these actions, claims and investigations could be material to the Company’s consolidated financial condition, results of operations, or cash flows in future periods.
Additional lawsuits and claims related to the 2017 cybersecurity incident may be asserted by or on behalf of consumers, customers, shareholders or others seeking damages or other related relief and additional inquiries from governmental agencies may be received or investigations by governmental agencies commenced.
Future Costs. We expect to incur significant legal and other professional services expenses associated with the cybersecurity incident in future periods. We will recognize these expenses as services are received. Costs related to the cybersecurity incident that will be incurred in future periods will also include increased expenses and capital investments for IT and security. We expect to incur increased expenses for insurance, finance, compliance activities, and to meet increased legal and regulatory requirements. We will also incur increased costs to provide free services to consumers including increased customer support costs.
Insurance Coverage. We maintain $125 million of cybersecurity insurance coverage, above a $7.5 million deductible, to limit our exposure to losses such as those related to the cybersecurity incident. As of December 31, 2017, the Company has recorded a receivable of $35.0 million and received payments of $15 million for costs incurred to date that are reimbursable and probable of recovery under our insurance coverage.
At December 31, 2017, accrued liabilities and insurance receivable related to the cybersecurity incident consisted of the following:
|
| | | | | | | | |
| | Accrued Liabilities | | Insurance Receivable |
| | (In millions) |
(Expenses incurred) insurance receivable recorded | | $ | (164.0 | ) | | $ | 50.0 |
|
Payments made (received) | | 88.4 |
| | (15.0 | ) |
Balance at December 31, 2017 | | $ | (75.6 | ) | | $ | 35.0 |
|
NOTES TO CONSOLIDATED FINANCIAL STATEMENTS
Leases. Our operating leases principally involve office space and office equipment. Rental expense for operating leases, which is recognized on a straight-line basis over the lease term, was $34.5 million, $29.1 million and $24.2 million for the twelve months ended December 31, 2017, 2016 and 2015, respectively. Our headquarters building ground lease has purchase options exercisable beginning in 2019, renewal options exercisable in 2048 and escalation clauses that began in 2009. Expected future minimum payment obligations for non-cancelable operating leases exceeding one year are as follows as of December 31, 2017:
|
| | | | |
Years ending December 31, | | Amount |
| | (In millions) |
2018 | | $ | 27.3 |
|
2019 | | 19.9 |
|
2020 | | 19.0 |
|
2021 | | 15.5 |
|
2022 | | 13.1 |
|
Thereafter | | 55.2 |
|
| | $ | 150.0 |
|
We have no material sublease agreements and as a result, expected sublease income is not reflected as a reduction in the total minimum rental obligations under operating leases in the table above.
Data Processing, Outsourcing Services and Other Agreements. We have separate agreements with IBM, Tata Consultancy Services, Fidelity Information Services, and others to outsource portions of our computer data processing operations, applications development, business continuity and recovery services, help desk service and desktop support functions, operation of our voice and data networks, maintenance and related functions and to provide certain other administrative and operational services. The agreements expire between 2018 and 2022. The estimated aggregate minimum contractual obligation remaining under these agreements is approximately $125 million as of December 31, 2017, with no future year’s minimum contractual obligation expected to exceed approximately $85 million. Annual payment obligations in regard to these agreements vary due to factors such as the volume of data processed; changes in our servicing needs as a result of new product offerings, acquisitions or divestitures; the introduction of significant new technologies; foreign currency; or the general rate of inflation. In certain circumstances (e.g., a change in control or for our convenience), we may terminate these data processing and outsourcing agreements, and, in doing so, certain of these agreements require us to pay significant termination fees.
Under our agreement with IBM (which covers our operations in North America and Europe), we have outsourced certain of our mainframe and midrange operations, help desk service and desktop support functions, and the operation of our voice and data networks. The scope of services provided by IBM, and the term of our agreement with respect to such services, varies by geography and location. The estimated future minimum contractual obligation under the revised North America (US and Canada) and Europe (UK and Spain) agreements is approximately $48 million for the remaining term, with no individual year's minimum expected to exceed approximately $24 million. We may terminate certain portions of this agreement without penalty in the event that IBM is in material breach of the terms of the agreement. During 2017, 2016 and 2015, we paid approximately $40 million, $45 million and $50 million, respectively, for these services.
Change in Control Agreements. We have entered into change in control severance agreements with certain key executives. The agreements provide for, among other things, certain payments and benefits in the event of a qualifying termination of employment (i.e., termination of employment by the executive for “good reason” or termination of employment by the Company without “cause,” each as defined in the agreements) following a change in control of the Company. In the event of a qualifying termination, the executive will become entitled to continuation of group health, dental, vision, life, disability, 401(k) and similar benefits for two or three years, depending on the eligibility, as well as a lump sum severance payment, all of which differs by executive.
The change in control agreements have a three-year term and automatically renew for another three years unless we elect not to renew the agreements. Change in control events potentially triggering benefits under the agreements would occur, subject to certain exceptions, if (1) any person acquires 20% or more of our voting stock; (2) upon a merger or other business combination, our shareholders receive less than two-thirds of the common stock and combined voting power of the new company; (3) we sell or otherwise dispose of all or substantially all of our assets; or (4) we liquidate or dissolve.
NOTES TO CONSOLIDATED FINANCIAL STATEMENTS
If these change in control agreements had been triggered as of December 31, 2017, payments of approximately $45.9 million would have been made (excluding tax gross-up amounts of $10.3 million). Under the Company’s existing director and employee stock benefit plans, a change in control generally would result in the immediate vesting of all outstanding stock options and satisfaction of the restrictions on any outstanding nonvested stock awards. With respect to unvested performance based share awards dependent upon the Company’s three-year relative total shareholder return, if at least one calendar year of performance during the performance period has been completed prior to the change in control event, the awards will be paid out based on the Company’s performance at that time; otherwise the payout of shares will be at 100% of the target award. For awards granted in 2017, the vesting described above occurs only if the awards are not assumed or continued in the change in control transaction or if the executive incurs a qualifying termination in connection with the change in control.
Guarantees. We will from time to time issue standby letters of credit, performance bonds or other guarantees in the normal course of business. The aggregate notional amount of all performance bonds and standby letters of credit is not material at December 31, 2017 and all have a remaining maturity of one year or less. We may issue other guarantees in the ordinary course of business. The maximum potential future payments we could be required to make under the guarantees is not material at December 31, 2017. We have agreed to guarantee the liabilities and performance obligations (some of which have limitations) of a certain debt collections and recovery management VIE under its commercial agreements. We cannot reasonably estimate our potential future payments under the guarantees and related provisions described above because we cannot predict when and under what circumstances these provisions may be triggered. We had no accruals related to guarantees on our Consolidated Balance Sheets at December 31, 2017.
General Indemnifications. We are the lessee under many real estate leases. It is common in these commercial lease transactions for us, as the lessee, to agree to indemnify the lessor and other related third parties for tort, environmental and other liabilities that arise out of or relate to our use or occupancy of the leased premises. This type of indemnity would typically make us responsible to indemnified parties for liabilities arising out of the conduct of, among others, contractors, licensees and invitees at or in connection with the use or occupancy of the leased premises. This indemnity often extends to related liabilities arising from the negligence of the indemnified parties, but usually excludes any liabilities caused by either their sole or gross negligence and their willful misconduct.
Certain of our credit agreements include provisions which require us to make payments to preserve an expected economic return to the lenders if that economic return is diminished due to certain changes in law or regulations. In certain of these credit agreements, we also bear the risk of certain changes in tax laws that would subject payments to non-U.S. lenders to withholding taxes.
In conjunction with certain transactions, such as sales or purchases of operating assets or services in the ordinary course of business, or the disposition of certain assets or businesses, we sometimes provide routine indemnifications, the terms of which range in duration and sometimes are not limited.
The Company has entered into indemnification agreements with its directors and executive officers. Under these agreements, the Company has agreed to indemnify such individuals to the fullest extent permitted by law against liabilities that arise by reason of their status as directors or officers and to advance expenses incurred by such individuals in connection with the related legal proceedings. The Company maintains directors and officers liability insurance coverage to reduce its exposure to such obligations.
We cannot reasonably estimate our potential future payments under the indemnities and related provisions described above because we cannot predict when and under what circumstances these provisions may be triggered. We have no accrual related to indemnifications on our Consolidated Balance Sheets at December 31, 2017 and 2016.
Subsidiary Dividend and Fund Transfer Limitations. The ability of some of our subsidiaries and associated companies to transfer funds to us is limited, in some cases, by certain restrictions imposed by foreign governments, which do not, individually or in the aggregate, materially limit our ability to service our indebtedness, meet our current obligations or pay dividends.
Contingencies. We are involved in legal proceedings, claims and litigation arising in the ordinary course of business. We periodically assess our exposure related to these matters based on the information which is available. We have recorded accruals in our Consolidated Financial Statements for those matters in which it is probable that we have incurred a loss and the amount of the loss, or range of loss, can be reasonably estimated.
Although the final outcome of these matters cannot be predicted with certainty, any possible adverse outcome arising from these matters is not expected to have a material impact on our Consolidated Financial Statements, either individually or in
NOTES TO CONSOLIDATED FINANCIAL STATEMENTS
the aggregate. However, our evaluation of the likely impact of these matters may change in the future. We accrue for unpaid legal fees for services performed to date.
7. INCOME TAXES
The provision for income taxes consisted of the following:
|
| | | | | | | | | | | |
| Twelve Months Ended December 31, |
| 2017 | | 2016 | | 2015 |
| (In millions) |
Current: | |
| | |
| | |
|
Federal | $ | 107.8 |
| | $ | 154.8 |
| | $ | 159.0 |
|
State | 13.2 |
| | 24.3 |
| | 14.7 |
|
Foreign | 71.7 |
| | 67.0 |
| | 56.8 |
|
| 192.7 |
| | 246.1 |
| | 230.5 |
|
Deferred: | |
| | |
| | |
|
Federal | (19.2 | ) | | 16.5 |
| | (7.5 | ) |
State | 1.3 |
| | 2.8 |
| | (9.3 | ) |
Foreign | (26.2 | ) | | (32.3 | ) | | (11.9 | ) |
| (44.1 | ) | | (13.0 | ) | | (28.7 | ) |
Provision for income taxes | $ | 148.6 |
| | $ | 233.1 |
| | $ | 201.8 |
|
Domestic and foreign income before income taxes was as follows:
|
| | | | | | | | | | | |
| Twelve Months Ended December 31, |
| 2017 | | 2016 | | 2015 |
| (In millions) |
U.S. | $ | 711.1 |
| | $ | 739.6 |
| | $ | 607.6 |
|
Foreign | 35.5 |
| | (11.4 | ) | | 29.0 |
|
| $ | 746.6 |
| | $ | 728.2 |
| | $ | 636.6 |
|
The provision for income taxes reconciles with the U.S. federal statutory rate, as follows:
|
| | | | | | | | | | | |
| Twelve Months Ended December 31, |
| 2017 | | 2016 | | 2015 |
| (In millions) |
Federal statutory rate | 35.0 | % | | 35.0 | % | | 35.0 | % |
| | | | | |
Provision computed at federal statutory rate | $ | 261.3 |
| | $ | 254.9 |
| | $ | 222.8 |
|
State and local taxes, net of federal tax benefit | 13.3 |
| | 17.2 |
| | 5.2 |
|
Foreign | (41.9 | ) | | (40.3 | ) | | (21.8 | ) |
Tax Cuts and Jobs Act of 2017 | (48.3 | ) | | — |
| | — |
|
Equity compensation | (26.7 | ) | | — |
| | — |
|
Tax reserves | 2.5 |
| | 11.9 |
| | 0.9 |
|
Other | (11.6 | ) | | (10.6 | ) | | (5.3 | ) |
Provision for income taxes | $ | 148.6 |
| | $ | 233.1 |
| | $ | 201.8 |
|
| | | | | |
Effective income tax rate | 19.9 | % | | 32.0 | % | | 31.7 | % |
We record deferred income taxes using enacted tax laws and rates for the years in which the taxes are expected to be paid. Deferred income tax assets and liabilities are recorded based on the differences between the financial reporting and
NOTES TO CONSOLIDATED FINANCIAL STATEMENTS
income tax bases of assets and liabilities. For additional information about our income tax policy, see Note 1 of the Notes to Consolidated Financial Statements.
Components of the deferred income tax assets and liabilities at December 31, 2017 and 2016, were as follows:
|
| | | | | | | |
| December 31, |
| 2017 | | 2016 |
| (In millions) |
Deferred income tax assets: | |
|
| |
|
Net operating and capital loss carryforwards | $ | 279.9 |
|
| $ | 213.2 |
|
Goodwill and intangible assets | 129.3 |
|
| 113.8 |
|
Employee compensation programs | 33.1 |
|
| 51.6 |
|
Foreign tax credits | 17.6 |
|
| 56.9 |
|
Employee pension benefits | 40.8 |
|
| 70.6 |
|
Reserves and accrued expenses | 23.8 |
|
| 18.5 |
|
Research and development costs | 26.7 |
|
| 13.7 |
|
Other | 8.7 |
|
| 21.0 |
|
Gross deferred income tax assets | 559.9 |
|
| 559.3 |
|
Valuation allowance | (401.8 | ) |
| (307.3 | ) |
Total deferred income tax assets, net | 158.1 |
|
| 252.0 |
|
|
|
|
|
|
|
Deferred income tax liabilities: | |
|
| |
|
Goodwill and intangible assets | (387.6 | ) |
| (507.0 | ) |
Undistributed earnings of foreign subsidiaries | (7.6 | ) |
| (30.1 | ) |
Depreciation | (41.5 | ) |
| (22.1 | ) |
Other | (20.6 | ) |
| (13.5 | ) |
Total deferred income tax liability | (457.3 | ) |
| (572.7 | ) |
Net deferred income tax liability | $ | (299.2 | ) |
| $ | (320.7 | ) |
Our deferred income tax assets and deferred income tax liabilities at December 31, 2017 and 2016, are included in the accompanying Consolidated Balance Sheets as follows:
|
| | | | | | | |
| December 31, |
| 2017 | | 2016 |
| (In millions) |
Long-term deferred income tax assets, included in other assets | $ | 5.9 |
| | $ | 4.7 |
|
Long-term deferred income tax liabilities | (305.1 | ) | | (325.4 | ) |
Net deferred income tax liability | $ | (299.2 | ) | | $ | (320.7 | ) |
We record deferred income taxes on the temporary differences of our foreign subsidiaries and branches, except for the temporary differences related to undistributed earnings of subsidiaries which we consider indefinitely invested. As of December 31, 2017, we have indefinitely invested $85.7 million attributable to pre-2004 undistributed earnings of our Canadian and Chilean subsidiaries. If the pre-2004 earnings were not considered indefinitely invested, $6.4 million of deferred withholding tax liability would have been provided. Further we are permanently invested with respect to the original investment in foreign subsidiaries. Therefore, we have not provided the deferred tax assets on the outside basis of these subsidiaries as we have no intent to sell or divest of these subsidiaries. Cumulative undistributed earnings were subject to a transition tax as a result of the Tax Act which we estimated to be zero. However, the Company has provided for local country withholding taxes related to these earnings.
At December 31, 2017, we had U.S. federal and state net operating loss carryforwards of $69.8 million which will expire at various times between 2018 and 2037. We also had foreign net operating loss carryforwards totaling $947.2 million of which $11.0 million will expire between 2018 and 2037 and the remaining $936.2 million will carryforward indefinitely.
NOTES TO CONSOLIDATED FINANCIAL STATEMENTS
Foreign capital loss carryforwards of $16.7 million may be carried forward indefinitely, and state capital loss carryforwards of $2.5 million will expire in 2018. We had foreign tax credit carryforwards of $17.6 million which will expire in the years 2025 through 2026. Additionally, we had U.S. and foreign research and development credit carryforwards of $26.7 million. The U.S. credits expire between 2018 through 2029 and the foreign credits have an indefinite expiration period. The deferred tax asset related to the net operating loss, capital loss carryforwards, foreign tax credit carryforwards, and research and development credit is $324.2 million of which $270.9 million has been fully reserved in the deferred tax valuation allowance.
Cash paid for income taxes, net of amounts refunded, was $215.7 million, $173.4 million and $202.9 million during the twelve months ended December 31, 2017, 2016 and 2015, respectively.
We recognize interest and penalties accrued related to unrecognized tax benefits in the provision for income taxes on our Consolidated Statements of Income.
A reconciliation of the beginning and ending amount of unrecognized tax benefits is as follows:
|
| | | | | | | |
| 2017 | | 2016 |
| (In millions) |
Beginning balance (January 1) | $ | 32.5 |
| | $ | 21.6 |
|
Increases related to prior year tax positions | 0.6 |
| | 4.1 |
|
Decreases related to prior year tax positions | (5.6 | ) | | (1.0 | ) |
Increases related to current year tax positions | 13.1 |
| | 12.8 |
|
Decreases related to settlements | (0.3 | ) | | (1.0 | ) |
Expiration of the statute of limitations for the assessment of taxes | (5.8 | ) | | (3.9 | ) |
Currency translation adjustment | 0.5 |
| | (0.1 | ) |
Ending balance (December 31) | $ | 35.0 |
| | $ | 32.5 |
|
We recorded liabilities of $38.0 million and $36.0 million for unrecognized tax benefits as of December 31, 2017 and 2016, respectively, which included interest and penalties of $3.0 million and $3.5 million, respectively. As of December 31, 2017 and 2016, the total amount of unrecognized benefits that, if recognized, would have affected the effective tax rate was $35.7 million and $33.3 million, respectively, which included interest and penalties of $2.6 million and $2.8 million, respectively. During 2017 and 2016 interest and penalties of $1.4 million and $1.1 million respectively were accrued.
Equifax and its subsidiaries are subject to U.S. federal, state and international income taxes. We are generally no longer subject to federal, state or international income tax examinations by tax authorities for years before 2013. Due to the potential for resolution of state and foreign examinations, and the expiration of various statutes of limitations, it is reasonably possible that Equifax’s gross unrecognized tax benefit balance may change within the next twelve months by a range of zero to $18.3 million.
The Tax Cuts and Jobs Act of 2017 (“Tax Act”), as signed by the President of the United States on December 22, 2017, significantly revises U.S. tax law. The legislation will positively impact the Company’s ongoing effective tax rate due to the reduction of the U.S. federal corporate tax rate from 35% to 21%. The Tax Act makes major changes to the U.S. international tax system. Under previous law, foreign earnings were subject to U.S. tax when repatriated to the U.S. Under the Tax Act, foreign earnings are generally exempt from U.S. tax. Additionally, there is a one-time deemed repatriation tax on undistributed foreign earnings and profits (the “transition tax”). The Tax Act imposes other U.S. taxes on “global intangible low taxed income” and “base erosion anti-abuse transactions.” Other significant changes include limitations on the deductibility of interest expense and executive compensation, and repeal of the deduction for domestic production activities. As a result of the current interpretation and estimated impact of the Tax Act, the Company recorded adjustments totaling a net tax benefit of $48.3 million in the fourth quarter of 2017 to provisionally account for the estimated impact.
Our preliminary estimate of the tax rate change resulted in a remeasurement of our net deferred tax liabilities of $85.1 million and a corresponding deferred income tax benefit in 2017. Our federal income tax expense for periods beginning in 2018 will be based on the new rate.
As a result of the changes the Tax Act makes to the taxation of foreign earnings, we recorded a valuation allowance related to the foreign tax credit carryover in the amount of $17.6 million. Based on our initial estimates, the Company recorded zero transition tax related to the Tax Act. However, the Company recognized additional tax expense of $16.4 million due to the inability to claim foreign tax credits in the current year.
NOTES TO CONSOLIDATED FINANCIAL STATEMENTS
As permitted by Staff Accounting Bulletin No. 118, provisional amounts estimated based on information available as of December 31, 2017 have been made for the adjustments to deferred tax assets and liabilities, state taxes, equity compensation, the calculation of the transition tax, the valuation allowance related to the foreign tax credit carryover and the 2017 dividends. These amounts are subject to change as we obtain information necessary to complete the calculations and clarifications to the U.S. tax code as they occur. We will recognize any changes to the provisional amounts as we refine our estimates and our interpretations of the application of the 2017 Tax Act.
The Company has not yet made a policy election with respect to its treatment of potential global intangible low-taxed income (“GILTI”). Companies can either account for taxes on GILTI as incurred or recognize deferred taxes when basis differences exist that are expected to affect the amount of the GILTI inclusion upon reversal. The Company is still in the process of analyzing the provisions of the Act associated with GILTI and the expected impact of GILTI on the Company in the future.
8. STOCK-BASED COMPENSATION
We have one active share-based award plan, the amended and restated 2008 Omnibus Incentive Plan. This plan was originally approved by our shareholders in 2008 and was amended and restated with shareholder approval in May 2013 to, among other things, increase the reserve for awards under the plan by 11 million shares. The plan provides our directors, officers and certain key employees with stock options, restricted stock units and performance share awards. The plan is described below. We expect to issue common shares held as either treasury stock or new issue shares upon the exercise of stock options or once shares vest pursuant to restricted stock units or performance share awards. Total stock-based compensation expense in our Consolidated Statements of Income during the twelve months ended December 31, 2017, 2016 and 2015, was as follows:
|
| | | | | | | | | | | | |
| | Twelve Months Ended December 31, |
| | 2017 | | 2016 | | 2015 |
| | (In millions) |
Cost of services | | $ | 7.2 |
| | $ | 4.5 |
| | $ | 5.0 |
|
Selling, general and administrative expenses | | 31.1 |
| | 32.6 |
| | 33.4 |
|
Stock-based compensation expense, before income taxes | | $ | 38.3 |
| | $ | 37.1 |
| | $ | 38.4 |
|
The total income tax benefit recognized for stock-based compensation expense was $13.7 million, $13.3 million and $13.7 million for the twelve months ended December 31, 2017, 2016 and 2015, respectively.
In conjunction with the adoption of ASU 2016-09, windfall tax benefits are to be presented as cash flows from operating activities on a prospective basis. As a result, we classified $26.7 million as cash flows from operating activities for the year ended December 31, 2017. Previous guidance required benefits of tax deductions in excess of recognized compensation cost to be reported as a financing cash flow, rather than as an operating cash flow. This requirement reduced operating cash flows and increased financing cash flows by $35.9 million and $30.0 million for the twelve months ended December 31, 2016 and 2015, respectively.
Stock Options. The 2008 Omnibus Incentive Plan provides that qualified and nonqualified stock options may be granted to officers and other employees. In conjunction with our acquisition of TALX, we assumed options outstanding under the legacy TALX stock option plan, which was approved by TALX shareholders. The 2008 Omnibus Incentive Plan requires that stock options be granted at exercise prices not less than market value on the date of grant. Generally, stock options are subject to graded vesting for periods of up to three years based on service, with 33% vesting for each year of completed service, and expire ten years from the grant date.
We use the binomial model to calculate the fair value of stock options granted on or after January 1, 2006. The binomial model incorporates assumptions regarding anticipated employee exercise behavior, expected stock price volatility, dividend yield and risk-free interest rate. Anticipated employee exercise behavior and expected post-vesting cancellations over the contractual term used in the binomial model were primarily based on historical exercise patterns. These historical exercise patterns indicated there was not significantly different exercise behavior between employee groups. For our expected stock price volatility assumption, we weighted historical volatility and implied volatility. We used daily observations for historical volatility, while our implied volatility assumption was based on actively traded options related to our common stock. The expected term is derived from the binomial model, based on assumptions incorporated into the binomial model as described above.
NOTES TO CONSOLIDATED FINANCIAL STATEMENTS
The fair value for stock options granted during the twelve months ended December 31, 2017, 2016 and 2015, was estimated at the date of grant, using the binomial model with the following weighted-average assumptions:
|
| | | | | | | | | | | |
| Twelve Months Ended December 31, |
| 2017 | | 2016 | | 2015 |
Dividend yield | 1.9 | % | | 1.2 | % | | 1.2 | % |
Expected volatility | 22.8 | % | | 19.4 | % | | 21.2 | % |
Risk-free interest rate | 1.1 | % | | 1.2 | % | | 1.3 | % |
Expected term (in years) | 4.8 |
| | 4.8 |
| | 4.8 |
|
Weighted-average fair value of stock options granted | $ | 22.20 |
| | $ | 20.62 |
| | $ | 16.75 |
|
The following table summarizes changes in outstanding stock options during the twelve months ended December 31, 2017, as well as stock options that are vested and expected to vest and stock options exercisable at December 31, 2017:
|
| | | | | | | | | | | | |
| Shares | | Weighted-Average Exercise Price | | Weighted-Average Remaining Contractual Term | | Aggregate Intrinsic Value |
| (In thousands) | | | | (In years) | | (In millions) |
Outstanding at December 31, 2016 | 1,228 |
| | $ | 66.81 |
| | | | |
|
Granted (all at market price) | 401 |
| | $ | 114.66 |
| |
| |
|
|
Exercised | (398 | ) | | $ | 48.23 |
| |
| |
|
|
Forfeited and canceled | (47 | ) | | $ | 103.13 |
| |
| |
|
|
Outstanding at December 31, 2017 | 1,184 |
| | $ | 87.64 |
| | 6.6 | | $ | 40.0 |
|
Vested and expected to vest at December 31, 2017 | 1,140 |
| | $ | 86.64 |
| | 6.6 | | $ | 39.5 |
|
Exercisable at December 31, 2017 | 636 |
| | $ | 62.62 |
| | 4.9 | | $ | 35.9 |
|
The aggregate intrinsic value amounts in the table above represent the difference between the closing price of Equifax’s common stock on December 31, 2017 and the exercise price, multiplied by the number of in-the-money stock options as of the same date. This represents the value that would have been received by the stock option holders if they had all exercised their stock options on December 31, 2017. In future periods, this amount will change depending on fluctuations in Equifax’s stock price. The total intrinsic value of stock options exercised during the twelve months ended December 31, 2017, 2016 and 2015, was $31.4 million, $64.8 million and $52.3 million, respectively. At December 31, 2017, our total unrecognized compensation cost related to stock options was $4.3 million with a weighted-average recognition period of 1.5 years.
The following table summarizes changes in outstanding options and the related weighted-average exercise price per share for the twelve months ended December 31, 2016 and 2015:
|
| | | | | | | | | | | | | |
| December 31, |
| 2016 | | 2015 |
| Shares | | Weighted- Average Price | | Shares | | Weighted- Average Price |
| (In thousands) | | | | (In thousands) | | |
Outstanding at the beginning of the year | 1,866 |
| | $ | 49.54 |
| | 2,579 |
| | $ | 42.54 |
|
Granted (all at market price) | 181 |
| | $ | 131.41 |
| | 189 |
| | $ | 97.21 |
|
Exercised | (779 | ) | | $ | 40.61 |
| | (888 | ) | | $ | 38.74 |
|
Forfeited and canceled | (40 | ) | | $ | 72.06 |
| | (14 | ) | | $ | 58.24 |
|
Outstanding at the end of the year | 1,228 |
| | $ | 66.81 |
| | 1,866 |
| | $ | 49.54 |
|
Exercisable at end of year | 856 |
| | $ | 48.43 |
| | 1,411 |
| | $ | 39.90 |
|
Other Stock Awards. Our 2008 Omnibus Incentive Plan also provides for awards of restricted stock units and performance shares or units that are settled in shares of our common stock that can be granted to executive officers, employees
NOTES TO CONSOLIDATED FINANCIAL STATEMENTS
and directors. Such stock awards are generally subject to cliff vesting over a period between one to three years based on service and may also have vesting conditions based on meeting specified performance goals.
The fair value of these stock awards is based on the fair market value of our common stock on the date of grant. However, stock awards granted prior to February 16, 2017 did not accrue or pay dividends during the vesting period, so the fair value on the date of grant for the pre-2017 awards was reduced by the present value of the expected dividends over the requisite service period (discounted using the appropriate risk-free interest rate). Stock awards granted during 2017 do include the right to dividends or dividend equivalents, which are accrued and payable only if and when the underlying stock vests and is payable.
Pursuant to our 2008 Omnibus Incentive Plan, certain executive officers have been granted performance shares in which the number of shares earned is dependent upon the Company’s three-year total shareholder return relative to the three-year total shareholder return of the companies in the S&P 500 stock index, as comprised on the grant date, subject to adjustment, and have also been granted performance shares in which the number of shares earned is dependent upon the Company's three-year cumulative adjusted earnings per share. The number of shares which could potentially be issued under these performance share awards ranges from zero to 200% of the target award. The grants outstanding subject to market performance as of December 31, 2017 would result in 278,644 shares outstanding at 100% of target and 557,288 at 200% of target at the end of the vesting period. Compensation expense for shares earned based on the Company's three-year total shareholder return is recognized on a straight-line basis over the measurement period and is based upon the fair market value of the shares estimated to be earned at the date of grant using a Monte-Carlo simulation. Compensation expense for shares earned based on the Company's three-year cumulative adjusted earnings per share is recognized on a straight-line basis over the measurement period based on the grant date fair value of our common stock and the number of awards expected to vest at each reporting date.
The following table summarizes changes in these other stock awards during the twelve months ended December 31, 2017, 2016 and 2015 and the related weighted-average grant date fair value:
|
| | | | | | |
| Shares | | Weighted-Average Grant Date Fair Value |
| (In thousands) | | |
|
Nonvested at December 31, 2014 | 1,700 |
| | $ | 57.52 |
|
Granted | 472 |
| | $ | 79.26 |
|
Vested | (698 | ) | | $ | 39.21 |
|
Forfeited | (43 | ) | | $ | 59.05 |
|
Nonvested at December 31, 2015 | 1,431 |
| | $ | 72.64 |
|
Granted | 460 |
| | $ | 84.07 |
|
Vested | (645 | ) | | $ | 55.28 |
|
Forfeited | (59 | ) | | $ | 73.54 |
|
Nonvested at December 31, 2016 | 1,187 |
| | $ | 87.54 |
|
Granted | 498 |
| | $ | 89.45 |
|
Vested | (632 | ) | | $ | 56.53 |
|
Forfeited | (42 | ) | | $ | 104.24 |
|
Nonvested at December 31, 2017 | 1,011 |
| | $ | 109.48 |
|
The total fair value of stock awards that vested during the twelve months ended December 31, 2017, 2016 and 2015, was $79.4 million, $71.7 million and $65.0 million, respectively, based on the weighted-average fair value on the vesting date, and $45.0 million, $38.8 million and $31.3 million, respectively, based on the weighted-average fair value on the date of grant. At December 31, 2017, our total unrecognized compensation cost related to these nonvested stock awards was $32.1 million with a weighted-average recognition period of 2.0 years.
9. SHAREHOLDER RIGHTS PLAN
The Company's Board of Directors terminated the previously adopted shareholder rights plan (sometimes referred to as a ‘poison pill’) effective February 19, 2015.
NOTES TO CONSOLIDATED FINANCIAL STATEMENTS
10. BENEFIT PLANS
We have defined benefit pension plans and defined contribution plans. We also maintain certain healthcare and life insurance benefit plans for eligible retired employees. The measurement date for our defined benefit pension plans and other postretirement benefit plans is December 31 of each year.
Pension Benefits. Pension benefits are provided through U.S. and Canadian defined benefit pension plans and two supplemental executive defined benefit pension plans.
U.S. and Canadian Retirement Plans. We sponsor a qualified defined benefit retirement plan (the U.S. Retirement Income Plan, or USRIP) that covers approximately 15% of current U.S. salaried employees who were hired on or before June 30, 2007, the last date on which an individual could be hired and enter the plan before the USRIP was frozen to new participation at December 31, 2008. This plan also covers many retirees as well as certain terminated but vested individuals not yet in retirement status. We also sponsor a defined benefit plan that covers most salaried and hourly employees in Canada (the Canadian Retirement Income Plan, or CRIP), also frozen to new hires on October 1, 2011.
During 2017, we adopted the new MP-2017 mortality scale in determining the liability for the U.S. pension plan. This updated scale partially offset the decrease in the discount rate in 2017, the net of which resulted in the increase in the projected benefit obligation as of December 31, 2017.
During 2016, we adopted the new MP-2016 mortality scale in determining the liability for the U.S. pension plan. This updated scale partially offset the decrease in the discount rate in 2016, the net of which resulted in the increase in the projected benefit obligation as of December 31, 2016.
During 2015, we adopted the new MP-2015 in determining the liability for the U.S. pension plan. This updated scale, along with the change in the discount rate, contributed to the decrease in the projected benefit obligation as of December 31, 2015.
On September 14, 2011, the Compensation Committee of the Board of Directors approved a redesign of our retirement plans for our currently active Canadian employees, effective January 1, 2013, and for our new hires hired on or after October 1, 2011. The changes to our retirement plan froze the Canadian Retirement Income Plan, or CRIP, a registered defined benefit pension plan, for employees who did not meet retirement-eligibility status under the CRIP as of December 31, 2012 (“Non-Grandfathered” participants). Under the plan amendment, the service credit for Non-Grandfathered participants froze, but these participants will continue to receive credit for salary increases and vesting service. Additionally, Non-Grandfathered employees and certain other employees not eligible to participate in the CRIP (i.e., new hires on or after October 1, 2011) are eligible to participate in the enhanced defined contribution component of the CRIP.
During the twelve months ended December 31, 2017, we did not make any contributions to the USRIP and made contributions of $1.5 million to the CRIP. During the twelve months ended December 31, 2016, we did not make any contributions to the USRIP and made contributions of $0.8 million to the CRIP. At December 31, 2017, the USRIP met or exceeded ERISA’s minimum funding requirements.
The annual report produced by our consulting actuaries specifies the funding requirements for our plans, based on projected benefits for plan participants, historical investment results on plan assets, current discount rates for liabilities, assumptions for future demographic developments and recent changes in statutory requirements. We may elect to make additional discretionary contributions to our plans in excess of minimum funding requirements, subject to statutory limitations.
Supplemental Retirement Plans. We maintain two supplemental executive retirement programs for certain key employees. The plans, which are unfunded, provide supplemental retirement payments, based on salary and years of service.
Other Benefits. We maintain certain healthcare and life insurance benefit plans for eligible retired employees. Substantially all of our U.S. employees may become eligible for the retiree healthcare benefits if they reach retirement age while working for us and satisfy certain years of service requirements. The retiree life insurance program covers employees who retired on or before December 31, 2003. We accrue the cost of providing healthcare benefits over the active service period of the employee.
NOTES TO CONSOLIDATED FINANCIAL STATEMENTS
Obligations and Funded Status. A reconciliation of the projected benefit obligations, plan assets and funded status of the plans is as follows:
|
| | | | | | | | | | | | | | | |
| Pension Benefits | | Other Benefits |
| 2017 | | 2016 | | 2017 | | 2016 |
| (In millions) |
Change in projected benefit obligation | |
| | |
| | |
| | |
|
Benefit obligation at January 1, | $ | 693.6 |
|
| $ | 662.7 |
|
| $ | 22.5 |
|
| $ | 19.6 |
|
Service cost | 4.0 |
|
| 3.6 |
|
| 0.4 |
|
| 0.3 |
|
Interest cost | 28.5 |
|
| 31.3 |
|
| 0.9 |
|
| 0.8 |
|
Plan participants' contributions | — |
|
| — |
|
| 0.5 |
|
| 0.6 |
|
Actuarial loss (gain) | 45.5 |
|
| 36.4 |
|
| 2.5 |
|
| 4.2 |
|
Foreign currency exchange rate changes | 3.1 |
|
| 1.4 |
|
| 0.1 |
|
| 0.2 |
|
Benefits paid | (43.1 | ) |
| (41.8 | ) |
| (2.7 | ) |
| (3.2 | ) |
Projected benefit obligation at December 31, | 731.6 |
|
| 693.6 |
|
| 24.2 |
|
| 22.5 |
|
Change in plan assets | |
|
| |
|
| |
|
| |
|
Fair value of plan assets at January 1, | 515.3 |
|
| 518.9 |
|
| 16.6 |
|
| 18.9 |
|
Actual return on plan assets | 81.2 |
|
| 31.7 |
|
| 2.9 |
|
| 1.2 |
|
Employer contributions | 5.9 |
|
| 5.2 |
|
| 2.2 |
|
| 2.6 |
|
Plan participants' contributions | — |
|
| — |
|
| 0.5 |
|
| 0.6 |
|
Foreign currency exchange rate changes | 1.8 |
|
| 1.3 |
|
| — |
|
| — |
|
Other disbursements | — |
|
| — |
|
| (2.4 | ) |
| (3.5 | ) |
Benefits paid | (43.1 | ) |
| (41.8 | ) |
| (2.7 | ) |
| (3.2 | ) |
Fair value of plan assets at December 31, | 561.1 |
|
| 515.3 |
|
| 17.1 |
|
| 16.6 |
|
Funded status of plan | $ | (170.5 | ) |
| $ | (178.3 | ) |
| $ | (7.1 | ) |
| $ | (5.9 | ) |
The accumulated benefit obligation for the USRIP, CRIP and Supplemental Retirement Plans was $722.3 million at December 31, 2017. The accumulated benefit obligation for the USRIP, CRIP and Supplemental Retirement Plans was $685.3 million at December 31, 2016.
At December 31, 2017, the USRIP and Supplemental Retirement Plans had projected benefit obligations and accumulated benefit obligations in excess of those plans’ respective assets. The projected benefit obligation, accumulated benefit obligation and fair value of plan assets for these plans in the aggregate were $675.2 million, $673.1 million and $510.9 million, respectively, at December 31, 2017. The projected benefit obligation, accumulated benefit obligation and fair value of plan assets for the CRIP were $56.4 million, $49.2 million and $50.2 million, respectively, at December 31, 2017.
At December 31, 2016, the USRIP and Supplemental Retirement Plans had projected benefit obligations and accumulated benefit obligations in excess of those plans’ respective assets. The projected benefit obligation, accumulated benefit obligation and fair value of plan assets for these plans in the aggregate were $643.4 million, $641.6 million and $468.3 million, respectively, at December 31, 2016. The projected benefit obligation, accumulated benefit obligation and fair value of plan assets for the CRIP were $50.2 million, $43.7 million and $47.0 million, respectively, at December 31, 2016.
NOTES TO CONSOLIDATED FINANCIAL STATEMENTS
The following table represents the net amounts recognized, or the funded status of our pension and other postretirement benefit plans, in our Consolidated Balance Sheets at December 31, 2017 and 2016:
|
| | | | | | | | | | | | | | | | |
| | Pension Benefits | | Other Benefits |
| | 2017 | | 2016 | | 2017 | | 2016 |
| | (In millions) |
Amounts recognized in the statements of financial position consist of: | | |
| | |
| | |
| | |
|
Noncurrent assets | | $ | — |
| | $ | — |
| | $ | — |
| | $ | — |
|
Current liabilities | | (5.4 | ) | | (4.2 | ) | | (0.2 | ) | | (0.2 | ) |
Long-term liabilities | | (165.1 | ) | | (174.1 | ) | | (6.9 | ) | | (5.7 | ) |
Net amount recognized | | $ | (170.5 | ) | | $ | (178.3 | ) | | $ | (7.1 | ) | | $ | (5.9 | ) |
Included in accumulated other comprehensive loss at December 31, 2017 and 2016, were the following amounts that have not yet been recognized in net periodic pension cost:
|
| | | | | | | | | | | | | | | | |
| | Pension Benefits | | Other Benefits |
| | 2017 | | 2016 | | 2017 | | 2016 |
| | (In millions) |
Prior service cost, net of accumulated taxes of $2.0 and $3.4 in 2017 and 2016, respectively, for pension benefits and $(0.5) and $(1.2) in 2017 and 2016, respectively, for other benefits | | $ | 6.3 |
| | $ | 5.6 |
| | $ | (1.8 | ) | | $ | (2.1 | ) |
Net actuarial loss, net of accumulated taxes of $91.0 and $143.5 in 2017 and 2016, respectively, for pension benefits and $3.1 and $5.0 in 2017 and 2016, respectively, for other benefits | | 243.2 |
| | 254.1 |
| | 9.8 |
| | 8.3 |
|
Impact of Tax Cuts and Jobs Act of 2017 | | 48.7 |
| | — |
| | 1.3 |
| | — |
|
Accumulated other comprehensive loss | | $ | 298.2 |
| | $ | 259.7 |
| | $ | 9.3 |
| | $ | 6.2 |
|
NOTES TO CONSOLIDATED FINANCIAL STATEMENTS
The following shows amounts recognized in other comprehensive income (loss) during the twelve months ended December 31, 2017 and 2016:
Changes in plan assets and benefit obligations recognized in other comprehensive income:
|
| | | | | | | | | | | | | | | | |
| | Pension Benefits | | Other Benefits |
| | 2017 | | 2016 | | 2017 | | 2016 |
| | (In millions) |
Amounts arising during the period: | | |
| | |
| | |
| | |
|
Net actuarial loss (gain), net of taxes of $0.0 and $15.9 in 2017 and 2016, respectively, for pension benefits and $0.1 and $1.6 in 2017 and 2016, respectively, for other benefits | | $ | 2.5 |
| | $ | 26.0 |
| | $ | 0.9 |
| | $ | 2.7 |
|
Foreign currency exchange rate gain, net of taxes of $(1.2) in 2017 and $0.1 in 2016, respectively, for pension benefits and $0.0 in 2017 and 2016, respectively, for other benefits | | (0.4 | ) | | 0.1 |
| | 1.1 |
| | 0.1 |
|
| | | | | | | | |
Amounts recognized in net periodic benefit cost during the period: | | |
| | |
| | |
| | |
|
Recognized actuarial loss, net of taxes of $(3.7) and $(5.1) in 2017 and 2016, respectively, for pension benefits and $(0.3) in 2017 and 2016, respectively, for other benefits | | (11.8 | ) | | (8.5 | ) | | (1.0 | ) | | (0.5 | ) |
Amortization of prior service cost, net of taxes of $(0.1) and $(0.3) 2017 and 2016, for pension benefits and $0.2 in 2017 and $0.4 in 2016 for other benefits | | (0.5 | ) | | (0.5 | ) | | 0.8 |
| | 0.7 |
|
Total recognized in other comprehensive income | | $ | (10.2 | ) | | $ | 17.1 |
| | $ | 1.8 |
| | $ | 3.0 |
|
Components of Net Periodic Benefit Cost
|
| | | | | | | | | | | | | | | | | | | | | | | |
| Pension Benefits | | Other Benefits |
| 2017 | | 2016 | | 2015 | | 2017 | | 2016 | | 2015 |
| (In millions) |
Service cost | $ | 4.0 |
| | $ | 3.6 |
| | $ | 4.2 |
| | $ | 0.4 |
| | $ | 0.3 |
| | $ | 0.3 |
|
Interest cost | 28.5 |
| | 31.3 |
| | 30.4 |
| | 0.9 |
| | 0.8 |
| | 0.7 |
|
Expected return on plan assets | (37.4 | ) | | (37.6 | ) | | (39.6 | ) | | (1.2 | ) | | (1.4 | ) | | (1.5 | ) |
Amortization of prior service cost | 0.6 |
| | 0.8 |
| | 0.9 |
| | (1.0 | ) | | (1.1 | ) | | (1.2 | ) |
Recognized actuarial loss (gain) | 15.5 |
| | 13.6 |
| | 15.8 |
| | 1.3 |
| | 0.8 |
| | 0.6 |
|
Total net periodic benefit cost (income) | $ | 11.2 |
| | $ | 11.7 |
| | $ | 11.7 |
| | $ | 0.4 |
| | $ | (0.6 | ) | | $ | (1.1 | ) |
The following represents the amount of prior service cost and actuarial loss included in accumulated other comprehensive loss that is expected to be recognized in net periodic benefit cost during the twelve months ending December 31, 2018:
|
| | | | | | | | |
| | Pension Benefits | | Other Benefits |
| | (In millions) |
Actuarial loss, net of taxes of $4.7 for pension benefits and $0.3 for other benefits | | $ | 14.9 |
| | $ | 1.1 |
|
Prior service cost, net of taxes of $0.1 for pension benefits and $(0.2) for other benefits | | $ | 0.4 |
| | $ | (0.8 | ) |
NOTES TO CONSOLIDATED FINANCIAL STATEMENTS
Weighted-Average Assumptions
|
| | | | | | | | | | | | |
Weighted-average assumptions used to determine benefit obligations at December 31, | | Pension Benefits | | Other Benefits |
| 2017 | | 2016 | | 2017 | | 2016 |
Discount rate | | 3.73 | % | | 4.23 | % | | 3.60 | % | | 3.98 | % |
Rate of compensation increase | | 4.88 | % | | 4.80 | % | | N/A |
| | N/A |
|
|
| | | | | | | | | | | | | | | | | | |
Weighted-average assumptions used to determine net periodic benefit cost at December 31, | | Pension Benefits | | Other Benefits |
| 2017 | | 2016 | | 2015 | | 2017 | | 2016 | | 2015 |
Discount rate | | 4.23 | % | | 4.86 | % | | 4.26 | % | | 3.98 | % | | 4.39 | % | | 4.05 | % |
Expected return on plan assets | | 7.14 | % | | 7.14 | % | | 7.44 | % | | 7.25 | % | | 7.25 | % | | 7.50 | % |
Rate of compensation increase | | 4.88 | % | | 4.80 | % | | 4.71 | % | | N/A |
| | N/A |
| | N/A |
|
Discount Rates. We determine our discount rates primarily based on high-quality, fixed-income investments and yield-to-maturity analyses specific to our estimated future benefit payments available as of the measurement date. Discount rates are reset annually on the measurement date to reflect current market conditions. We use a third-party yield curve to develop our discount rates. The yield curve provides discount rates related to a dedicated high-quality bond portfolio whose cash flows extend beyond the current period, from which we choose a rate matched to the expected benefit payments required for each plan.
Expected Return on Plan Assets. The expected rate of return on plan assets is based on both our historical returns and forecasted future investment returns by asset class, as provided by our external investment advisor. In 2017, our U.S. pension plan investment gain of 17.9% was above the expected return of 7.25% for the sixth time in nine years. The expected return for the USRIP for 2018 is 7.25%. The CRIP earned 7.8% in 2017 which was above its expected return of 6.0% for the seventh time in nine years. The expected return for the CRIP for 2018 is 6.0%. The CRIP has a lower expected return due to a higher asset allocation to fixed income securities.
The calculation of the net periodic benefit cost for the USRIP and CRIP utilizes a market-related value of assets. The market-related value of assets recognizes the difference between actual returns and expected returns over five years at a rate of 20% per year.
Healthcare Costs. For the U.S. plan, an initial 6.7% annual rate of increase in the per capita cost of covered healthcare benefits was assumed for 2018 for pre-Medicare coverage. The rate was assumed to decrease gradually to an ultimate rate of 5.0% by 2023. An initial 7.0% annual rate of increase in the per capita cost of covered healthcare benefits was assumed for 2017 for post-Medicare coverage. For the Canadian plan, an initial 5.5% annual rate of increase in the per capita cost of covered healthcare benefits was assumed for 2018. The rate was assumed to decrease gradually to an ultimate rate of 5.0% by 2019. Assumed healthcare cost trend rates have a significant effect on the amounts reported for the healthcare plan. A one-percentage point change in assumed healthcare cost trend rates at December 31, 2017 would have had the following effects:
|
| | | | | | | | |
| | 1-Percentage Point Increase | | 1-Percentage Point Decrease |
| | (In millions) |
Effect on total service and interest cost components | | $ | 0.1 |
| | $ | (0.1 | ) |
Effect on accumulated postretirement benefit obligation | | $ | 1.5 |
| | $ | (1.4 | ) |
NOTES TO CONSOLIDATED FINANCIAL STATEMENTS
We estimate that the future benefits payable for our retirement and postretirement plans are as follows at December 31, 2017:
|
| | | | | | | | | | | | |
Years ending December 31, | | U.S. Defined Benefit Plans | | Non-U.S. Defined Benefit Plans | | Other Benefit Plans |
| | (In millions) |
2018 | | $ | 42.6 |
| | $ | 1.9 |
| | $ | 1.8 |
|
2019 | | $ | 43.6 |
| | $ | 2.0 |
| | $ | 1.8 |
|
2020 | | $ | 43.2 |
| | $ | 2.0 |
| | $ | 1.9 |
|
2021 | | $ | 43.1 |
| | $ | 2.1 |
| | $ | 1.9 |
|
2022 | | $ | 42.8 |
| | $ | 2.2 |
| | $ | 1.9 |
|
Next five fiscal years to December 31, 2027 | | $ | 204.9 |
| | $ | 12.2 |
| | $ | 9.5 |
|
Fair Value of Plan Assets. The fair value of the pension assets at December 31, 2017 and 2016, are as follows:
|
| | | | | | | | | | | | | | | | | |
| | | |
| | Fair Value Measurements at Reporting Date Using: |
| | | Fair Value at December 31, 2017 | | Quoted Prices in Active Markets for Identical Assets (Level 1) | | Significant Other Observable Inputs (Level 2) | | Significant Unobservable Inputs (Level 3) |
| | | (In millions) |
Large-Cap Equity | (1) | | $ | 125.5 |
| | $ | 125.5 |
| | $ | — |
| | $ | — |
|
Small- and Mid-Cap Equity | (1) | | 39.0 |
| | 39.0 |
| | — |
| | — |
|
International Equity | (1) (2) | | 105.1 |
| | 13.2 |
| | 91.9 |
| | — |
|
Fixed Income | (2) | | 204.0 |
| | — |
| | 204.0 |
| | — |
|
Private Equity | (3) | | 24.1 |
| | — |
| | — |
| | 24.1 |
|
Hedge Funds | (4) | | 35.0 |
| | — |
| | — |
| | 35.0 |
|
Real Assets | (5) | | 18.7 |
| | — |
| | — |
| | 18.7 |
|
Cash | (1) | | 9.7 |
| | 9.7 |
| | — |
| | — |
|
Total | | | $ | 561.1 |
| | $ | 187.4 |
| | $ | 295.9 |
| | $ | 77.8 |
|
|
| | | | | | | | | | | | | | | | | |
| | | |
| | Fair Value Measurements at Reporting Date Using: |
| | | Fair Value at December 31, 2016 | | Quoted Prices in Active Markets for Identical Assets (Level 1) | | Significant Other Observable Inputs (Level 2) | | Significant Unobservable Inputs (Level 3) |
| | | (In millions) |
Large-Cap Equity | (1) | | $ | 128.1 |
| | $ | 128.1 |
| | $ | — |
| | $ | — |
|
Small- and Mid-Cap Equity | (1) | | 31.4 |
| | 31.4 |
| | — |
| | — |
|
International Equity | (1) (2) | | 80.8 |
| | 15.6 |
| | 65.2 |
| | — |
|
Fixed Income | (2) | | 174.2 |
| | — |
| | 174.2 |
| | — |
|
Private Equity | (3) | | 33.5 |
| | — |
| | — |
| | 33.5 |
|
Hedge Funds | (4) | | 33.7 |
| | — |
| | — |
| | 33.7 |
|
Real Assets | (5) | | 19.3 |
| | — |
| | — |
| | 19.3 |
|
Cash | (1) | | 14.3 |
| | 14.3 |
| | — |
| | — |
|
Total | | | $ | 515.3 |
| | $ | 189.4 |
| | $ | 239.4 |
| | $ | 86.5 |
|
| |
(1) | Fair value is based on observable market prices for the assets. |
NOTES TO CONSOLIDATED FINANCIAL STATEMENTS
| |
(2) | For the portion of this asset class categorized as Level 2, fair value is determined using dealer and broker quotations, certain pricing models, bid prices, quoted prices for similar assets and liabilities in active markets, or other inputs that are observable or can be corroborated by observable market data. |
| |
(3) | Private equity investments are initially valued at cost. Fund managers periodically review the valuations utilizing subsequent company-specific transactions or deterioration in the company’s financial performance to determine if fair value adjustments are necessary. Private equity investments are typically viewed as long term, less liquid investments with return of capital coming via cash distributions from the sale of underlying fund assets. The Plan intends to hold these investments through each fund’s normal life cycle and wind down period. As of December 31, 2017 and 2016, we had $10.7 million and $12.3 million of remaining commitments related to these private equity investments. |
| |
(4) | Fair value is reported by the fund manager based on observable market prices for actively traded assets within the funds, as well as financial models, comparable financial transactions or other factors relevant to the specific asset for assets with no observable market. These investments are redeemable quarterly with a range of 30 – 90 days notice. |
| |
(5) | The fair value of Real Assets are reported by the fund manager based on a combination of the following valuation approaches: current replacement cost less deterioration and obsolescence, a discounted cash flow model of income streams, and comparable market sales. As of December 31, 2017 and 2016, we had $0.5 million of remaining commitments related to the real asset investments. |
The following table shows a reconciliation of the beginning and ending balances for assets valued using significant unobservable inputs for the years ended December 31, 2017 and 2016:
|
| | | | | | | | | | | |
| Private Equity | | Hedge Funds | | Real Assets |
| (In millions) |
Balance at December 31, 2015 | $ | 41.9 |
| | $ | 54.0 |
| | $ | 17.4 |
|
Return on plan assets: | | | | | |
Unrealized | 0.2 |
| | 0.5 |
| | 0.7 |
|
Realized | 1.0 |
| | — |
| | 0.1 |
|
Purchases | 1.7 |
| | — |
| | 2.0 |
|
Sales | (11.3 | ) | | (20.8 | ) | | (0.9 | ) |
Balance at December 31, 2016 | $ | 33.5 |
| | $ | 33.7 |
| | $ | 19.3 |
|
Return on plan assets: | |
| | |
| | |
|
Unrealized | $ | (1.8 | ) | | $ | 1.8 |
| | $ | 0.1 |
|
Realized | 1.0 |
| | — |
| | (0.1 | ) |
Purchases | 1.0 |
| | — |
| | 0.5 |
|
Sales | (9.6 | ) | | (0.5 | ) | | (1.1 | ) |
Balance at December 31, 2017 | $ | 24.1 |
| | $ | 35.0 |
| | $ | 18.7 |
|
NOTES TO CONSOLIDATED FINANCIAL STATEMENTS
The fair value of the postretirement assets at December 31, 2017 and 2016, are as follows:
|
| | | | | | | | | | | | | | | | | |
| | | |
| | Fair Value Measurements at Reporting Date Using: |
Description | | Fair Value at December 31, 2017 | | Quoted Prices in Active Markets for Identical Assets (Level 1) | | Significant Other Observable Inputs (Level 2) | | Significant Unobservable Inputs (Level 3) |
| | | (In millions) |
Large-Cap Equity | (1) | | $ | 4.2 |
| | $ | 4.2 |
| | $ | — |
| | $ | — |
|
Small- and Mid-Cap Equity | (1) | | 1.3 |
| | 1.3 |
| | — |
| | — |
|
International Equity | (1) (2) | | 2.7 |
| | 0.5 |
| | 2.2 |
| | — |
|
Fixed Income | (2) | | 6.0 |
| | — |
| | 6.0 |
| | — |
|
Private Equity | (3) | | 0.8 |
| | — |
| | — |
| | 0.8 |
|
Hedge Funds | (4) | | 1.2 |
| | — |
| | — |
| | 1.2 |
|
Real Assets | (5) | | 0.6 |
| | — |
| | — |
| | 0.6 |
|
Cash | (1) | | 0.3 |
| | 0.3 |
| | — |
| | — |
|
Total | | | $ | 17.1 |
| | $ | 6.3 |
| | $ | 8.2 |
| | $ | 2.6 |
|
|
| | | | | | | | | | | | | | | | | |
| | | |
| | Fair Value Measurements at Reporting Date Using: |
Description | | Fair Value at December 31, 2016 | | Quoted Prices in Active Markets for Identical Assets (Level 1) | | Significant Other Observable Inputs (Level 2) | | Significant Unobservable Inputs (Level 3) |
| | | (In millions) |
Large-Cap Equity | (1) | | $ | 4.5 |
| | $ | 4.5 |
| | $ | — |
| | $ | — |
|
Small- and Mid-Cap Equity | (1) | | 1.1 |
| | 1.1 |
| | — |
| | — |
|
International Equity | (1) (2) | | 2.0 |
| | 0.5 |
| | 1.5 |
| | — |
|
Fixed Income | (2) | | 5.4 |
| | — |
| | 5.4 |
| | — |
|
Private Equity | (3) | | 1.2 |
| | — |
| | — |
| | 1.2 |
|
Hedge Funds | (4) | | 1.2 |
| | — |
| | — |
| | 1.2 |
|
Real Assets | (5) | | 0.7 |
| | — |
| | — |
| | 0.7 |
|
Cash | (1) | | 0.5 |
| | 0.5 |
| | — |
| | — |
|
Total | | | $ | 16.6 |
| | $ | 6.6 |
| | $ | 6.9 |
| | $ | 3.1 |
|
| |
(1) | Fair value is based on observable market prices for the assets. |
| |
(2) | For the portion of this asset class categorized as Level 2, fair value is determined using dealer and broker quotations, certain pricing models, bid prices, quoted prices for similar assets and liabilities in active markets, or other inputs that are observable or can be corroborated by observable market data. |
| |
(3) | Private equity investments are initially valued at cost. Fund managers periodically review the valuations utilizing subsequent company-specific transactions or deterioration in the company’s financial performance to determine if fair value adjustments are necessary. Private equity investments are typically viewed as long term, less liquid investments with return of capital coming via cash distributions from the sale of underlying fund assets. The Plan intends to hold these investments through each fund’s normal life cycle and wind down period. |
| |
(4) | Fair value is reported by the fund manager based on observable market prices for actively traded assets within the funds, as well as financial models, comparable financial transactions or other factors relevant to the specific asset for assets with no observable market. These investments are redeemable quarterly with a range of 30 – 90 days notice. |
| |
(5) | The fair value of Real Assets are reported by the fund manager based on a combination of the following valuation approaches: current replacement cost less deterioration and obsolescence, a discounted cash flow model of income streams and comparable market sales. |
NOTES TO CONSOLIDATED FINANCIAL STATEMENTS
Gross realized and unrealized gains and losses, purchases and sales for Level 3 postretirement assets were not material for the twelve months ended December 31, 2017.
USRIP, or the Plan, Investment and Asset Allocation Strategies. The primary goal of the asset allocation strategy of the Plan is to produce a total investment return which will satisfy future annual cash benefit payments to participants and minimize future contributions from the Company. Additionally, this strategy will diversify the plan assets to minimize nonsystemic risk and provide reasonable assurance that no single security or class of security will have a disproportionate impact on the Plan. Investment managers are required to abide by the provisions of ERISA. Standards of performance for each manager include an expected return versus an assigned benchmark, a measure of volatility, and a time period of evaluation.
The asset allocation strategy is determined by our external advisor forecasting investment returns by asset class and providing allocation guidelines to maximize returns while minimizing the volatility and correlation of those returns. Investment recommendations are made by our external advisor, working in conjunction with our in-house Investment Committee. The asset allocation and ranges are approved by our in-house Investment Committee and Plan Administrators, who are Named Fiduciaries under ERISA.
The Plan, in an effort to meet asset allocation objectives, utilizes a variety of asset classes which have historically produced returns which are relatively uncorrelated to those of the S&P 500 in most environments. Asset classes included in this category of alternative assets include hedge funds, private equity (including secondary private equity) and real assets (real estate, funds of hard asset securities and private equity funds focused on real assets). The primary benefits of using these types of asset classes are: (1) their non-correlated returns reduce the overall volatility of the Plan’s portfolio of assets, and (2) their ability to produce superior risk-adjusted returns. Additionally, the Plan allows certain of their managers, subject to specific risk constraints, to utilize derivative instruments in order to enhance asset return, reduce volatility or both. Derivatives are primarily employed by the Plans in their fixed income portfolios and in the hedge fund-of-funds area. Derivatives can be used for hedging purposes to reduce risk.
No shares of Equifax common stock were directly owned by the Plan at December 31, 2017 or 2016. Not more than 5% of the portfolio (at cost) shall be invested in the securities of any one issuer, with the exceptions of U.S. Treasury and government agency securities.
The following asset allocation ranges and actual allocations were in effect as of December 31, 2017 and 2016:
|
| | | | | | | | | |
| Range | | Actual |
USRIP | 2017 | | 2016 | | 2017 | | 2016 |
Large-Cap Equity | 15% - 40% | | 15% - 40% | | 24.7 | % | | 27.3 | % |
Small- and Mid-Cap Equity | 0% - 15% | | 0% - 15% | | 7.6 | % | | 6.7 | % |
International Equity | 10% - 30% | | 10% - 30% | | 15.6 | % | | 12.3 | % |
Private Equity | 2% - 10% | | 2% - 10% | | 4.7 | % | | 7.2 | % |
Hedge Funds | 0% - 10% | | 0% - 10% | | 6.8 | % | | 7.2 | % |
Real Assets | 2% - 10% | | 2% - 10% | | 3.7 | % | | 4.1 | % |
Fixed Income | 20% - 55% | | 20% - 55% | | 35.1 | % | | 32.3 | % |
Cash | 0% - 15% | | 0% - 15% | | 1.8 | % | | 2.9 | % |
CRIP Investment and Asset Allocation Strategies. The primary goal of the asset allocation strategy of the Plan is to produce a total investment return which will satisfy future annual cash benefit payments to participants and minimize future contributions from the Company. Additionally, this strategy will diversify the plan assets to minimize nonsystemic risk and provide reasonable assurance that no single security or class of security will have a disproportionate impact on the Plan. Due to the high funded status of the Plan, the Investment Committee of the CRIP has adopted a conservative asset allocation of 50/50 in equities and fixed income. The Investment Committee maintains an investment policy for the CRIP, which imposes certain limitations and restrictions regarding allowable types of investments. The current investment policy imposes those restrictions on investments or transactions such as (1) Equifax common stock or securities, except as might be incidental to any pooled funds which the plan may have, (2) commodities or loans, (3) short sales and the use of margin accounts, (4) put and call options, (5) private placements, and (6) transactions which are “related-party” in nature as specified by the Canadian Pension Benefits Standards Act and its regulations.
NOTES TO CONSOLIDATED FINANCIAL STATEMENTS
The following specifies the asset allocation ranges and actual allocation as of December 31, 2017 and 2016:
|
| | | | | | | |
| | | Actual |
CRIP | Range | | 2017 | | 2016 |
Canadian Equities | 25% - 50% | | 35.2 | % | | 34.7 | % |
International Equities (including U.S. Equities) | 0% - 19% | | 14.9 | % | | 14.9 | % |
Fixed Income | 40% - 60% | | 49.1 | % | | 49.1 | % |
Money Market | 0% - 10% | | 0.8 | % | | 1.3 | % |
Equifax Retirement Savings Plans. Equifax sponsors a tax qualified defined contribution plan, the Equifax Inc.
401(k) Plan, or the Plan. We provide a discretionary match of participants’ contributions, up to four or six percent of employees eligible pay depending on certain eligibility rules under the Plan. We also provide a discretionary direct contribution to certain eligible employees, the percentage of which is based upon an employee’s credited years of service. Company contributions for the Plan during the twelve months ended December 31, 2017, 2016 and 2015 were $29.7 million, $27.1 million and $23.2 million, respectively.
Foreign Retirement Plans. We also maintain defined contribution plans for certain employees in Australia, the U.K., Ireland and Canada. For the years ended December 31, 2017, 2016 and 2015, our contributions related to these plans were $7.3 million, $5.9 million, and $0.7 million, respectively.
Deferred Compensation Plans. We maintain deferred compensation plans that allow for certain management employees and the Board of Directors to defer the receipt of compensation (such as salary, incentive compensation, commissions or shares payable under vested restricted stock units) until a later date based on the terms of the plans. The Company also makes contributions to the accounts of certain executives who are not eligible to participate in either of the Supplemental Retirement Plans. The benefits under our deferred compensation plans are guaranteed by the assets of a grantor trust which, through our funding, make investments in certain mutual funds. The purpose of this trust is to ensure the distribution of benefits accrued by participants of the deferred compensation plans in case of a change in control, as defined in the trust agreement.
Annual Incentive Plan. We have a shareholder-approved Annual Incentive Plan, which is a component of our amended and restated 2008 Omnibus Incentive Plan, for certain key officers that provides for annual or long-term cash awards at the end of various measurement periods, based on the earnings per share, revenue and/or various other criteria over the measurement period. Our total accrued incentive compensation for all incentive plans included in accrued salaries and bonuses on our Consolidated Balance Sheets was $44.9 million and $90.0 million at December 31, 2017 and 2016, respectively.
Employee Benefit Trusts. We maintain employee benefit trusts for the purpose of satisfying obligations under certain benefit plans. These trusts held 0.6 million shares of Equifax stock with a value, at cost, of $5.9 million at December 31, 2017 and 2016, as well as cash, which was not material for both periods presented. The employee benefits trusts are as follows:
| |
• | The Executive Life and Supplemental Retirement Benefit Plan Grantor Trust was used to ensure that the insurance premiums due under the Executive Life and Supplemental Retirement Benefit Plan were paid in case we fail to make scheduled payments following a change in control, as defined in this trust agreement. This trust was terminated in 2016 as the obligations noted above were satisfied. |
| |
• | The Supplemental Retirement Plan Grantor Trust’s assets are dedicated to ensure the payment of benefits accrued under our Supplemental Retirement Plan in case of a change in control, as defined in this trust agreement. |
The assets in these plans which are recorded on our Consolidated Balance Sheets are subject to creditor’s claims in case of insolvency of Equifax Inc.
NOTES TO CONSOLIDATED FINANCIAL STATEMENTS
11. ACCUMULATED OTHER COMPREHENSIVE INCOME
Changes in accumulated other comprehensive income by component, after tax, for the twelve months ended December 31, 2017, are as follows:
|
| | | | | | | | | | | | | | | | |
| Foreign currency | | Pension and other postretirement benefit plans | | Cash flow hedging transactions | | | Total |
| (In millions) |
Balance, December 31, 2016 | $ | (262.0 | ) | | $ | (265.9 | ) | | $ | (1.0 | ) | | | $ | (528.9 | ) |
Other comprehensive income before reclassifications | 158.7 |
| | (4.0 | ) | | (0.2 | ) | | | 154.5 |
|
Amounts reclassified from accumulated other comprehensive income | — |
| | 12.4 |
| | — |
| | | 12.4 |
|
Net current-period other comprehensive income | 158.7 |
| | 8.4 |
| | (0.2 | ) | | | 166.9 |
|
Amounts reclassified to retained earnings | — |
| | (50.0 | ) | | $ | — |
| | | (50.0 | ) |
Balance, December 31, 2017 | $ | (103.3 | ) | | $ | (307.5 | ) | | $ | (1.2 | ) | | | $ | (412.0 | ) |
Reclassifications out of accumulated other comprehensive income for the twelve months ended December 31, 2017, are as follows:
|
| | | | | | |
Details about accumulated other comprehensive income components | | Amount reclassified from accumulated other comprehensive income | | Affected line item in the statement where net income is presented |
| | (In millions) |
Amortization of pension and other postretirement plan items: | | |
| | |
Prior service cost | | $ | 0.4 |
| | (1) |
Recognized actuarial loss | | (16.8 | ) | | (1) |
| | (16.4 | ) | | Total before tax |
| | 4.0 |
| | Tax benefit |
| | $ | (12.4 | ) | | Net of tax |
| |
(1) | These accumulated other comprehensive income components are included in the computation of net periodic pension cost (See Note 10 Benefit Plans for additional details). |
Changes in accumulated other comprehensive income related to noncontrolling interests were not material as of December 31, 2017.
12. RESTRUCTURING CHARGES
In the fourth quarter of 2016 and the first quarter of 2015, we recorded a $5.7 million ($3.7 million, net of tax) and $20.7 million ($13.2 million, net of tax) restructuring charge, respectively, all of which was recorded in selling, general and administrative expenses on our Consolidated Statements of Income. These charges were recorded to general corporate expense and resulted from our continuing efforts to realign our internal resources to support the Company’s strategic objectives and increase the integration of our global operations. The 2016 restructuring charge primarily relates to a reduction in headcount. Payments related to the 2016 restructuring charge have been substantially completed in 2017.
The 2015 restructuring charge primarily relates to a reduction of headcount of approximately 300 positions resulting in a charge of $16.2 million, which was accrued for under existing severance plans or statutory requirements. The remainder was related to costs associated with real estate exits of $1.2 million and other integration costs of $3.3 million. Generally, severance benefits for our U.S. and international employees are paid in the form of a lump sum cash payment according to the number of weeks of severance benefit provided to the employee. Payments related to the above restructuring charges totaled $16.6 million for the twelve months ended December 31, 2015. Payments related to the 2015 restructuring charges were substantially completed in 2016.
NOTES TO CONSOLIDATED FINANCIAL STATEMENTS
13. SEGMENT INFORMATION
Organizational Realignment. In the first quarter of 2016, we acquired Veda, which operates primarily in Australia and New Zealand. We have included Veda's operations within a newly-created Asia Pacific reporting unit within the International operating segment. Additionally, we moved the TDX Australia and India operations that were included in our Europe reporting unit, along with corporate assets including equity method investments in Russia and India, to the Asia Pacific reporting unit to align with how we manage our business. Our financial results for the year ended December 31, 2015 reflect our new organizational structure. Additionally in 2016, we renamed our Personal Solutions operating segment Global Consumer Solutions.
In 2015, the personal solutions business in the United Kingdom was consolidated into the North America Personal Solutions segment, which was reorganized into the Global Consumer Solutions segment. Additionally in 2015, the direct to consumer reseller businesses in the U.S., Canada, and the United Kingdom were also consolidated into the Global Consumer Solutions segment. These changes were driven by an enterprise wide strategy to maximize the penetration of our products and services in our targeted markets. We determined that market focus and operating efficiency could be further improved by reorganizing and consolidating the United States, Canada and the United Kingdom Global Consumer Solutions and Direct to Consumer Reseller operating activities into one segment, Global Consumer Solutions. As a result, we modified our segment reporting effective 2015.
Reportable Segments. We manage our business and report our financial results through the following four reportable segments, which are the same as our operating segments:
| |
• | U.S. Information Solutions |
| |
• | Global Consumer Solutions |
The accounting policies of the reportable segments are the same as those described in our summary of significant accounting policies (see Note 1). We evaluate the performance of these reportable segments based on their operating revenue, operating income and operating margins, excluding any unusual or infrequent items, if any. The measurement criteria for segment profit or loss and segment assets are substantially the same for each reportable segment. Inter-segment sales are not material for all periods presented. All transactions between segments are accounted for at fair market value or cost depending on the nature of the transaction, and no timing differences occur between segments.
A summary of segment products and services is as follows:
U.S. Information Solutions. This segment includes consumer and commercial information services (such as credit information and credit scoring, credit modeling services and portfolio analytics (decisioning tools), which are derived from our databases of business credit and financial information, locate services, fraud detection and prevention services, identity verification services and other consulting services); mortgage loan origination information; financial marketing services; and identity management.
International. This segment includes information services products, which includes consumer and commercial services (such as credit and financial information, credit scoring and credit modeling services), credit and other marketing products and services. In Asia Pacific, Europe, Latin America and Canada, we also provide information, technology and services to support debt collections and recovery management.
Workforce Solutions. This segment includes employment, income and social security number verification services as well as complementary payroll-based transaction services and employment tax management services.
Global Consumer Solutions. This segment includes credit information, credit monitoring and identity theft protection products sold directly to consumers via the internet and in various hard-copy formats in the U.S., Canada, and the U.K. We also sell consumer and credit information to resellers who combine our information with other information to provide direct to consumer monitoring, reports and scores.
NOTES TO CONSOLIDATED FINANCIAL STATEMENTS
Segment information for the twelve months ended December 31, 2017, 2016 and 2015 and as of December 31, 2017 and 2016 is as follows:
|
| | | | | | | | | | | | |
| | Twelve Months Ended December 31, |
Operating revenue: | | 2017 | | 2016 | | 2015 |
| | (In millions) |
U.S. Information Solutions | | $ | 1,262.7 |
| | $ | 1,236.5 |
| | $ | 1,171.3 |
|
International | | 932.3 |
| | 803.6 |
| | 568.5 |
|
Workforce Solutions | | 764.2 |
| | 702.2 |
| | 577.7 |
|
Global Consumer Solutions | | 403.0 |
| | 402.6 |
| | 346.1 |
|
Total operating revenue | | $ | 3,362.2 |
| | $ | 3,144.9 |
| | $ | 2,663.6 |
|
|
| | | | | | | | | | | | |
| | Twelve Months Ended
December 31, |
Operating income: | | 2017 | | 2016 | | 2015 |
| | (In millions) |
U.S. Information Solutions | | $ | 539.1 |
| | $ | 537.0 |
| | $ | 491.2 |
|
International | | 169.4 |
| | 111.4 |
| | 113.5 |
|
Workforce Solutions | | 331.9 |
| | 295.5 |
| | 218.8 |
|
Global Consumer Solutions | | 106.2 |
| | 112.4 |
| | 95.2 |
|
General Corporate Expense | | (322.0 | ) | | (238.4 | ) | | (224.8 | ) |
Total operating income | | $ | 824.6 |
| | $ | 817.9 |
| | $ | 693.9 |
|
|
| | | | | | | | |
| | December 31, |
Total assets: | | 2017 | | 2016 |
| | (In millions) |
U.S. Information Solutions | | $ | 1,587.3 |
| | $ | 1,824.0 |
|
International | | 3,145.7 |
| | 2,932.5 |
|
Workforce Solutions | | 1,227.4 |
| | 1,337.0 |
|
Global Consumer Solutions | | 254.0 |
| | 193.7 |
|
General Corporate | | 1,019.0 |
| | 376.8 |
|
Total assets | | $ | 7,233.4 |
| | $ | 6,664.0 |
|
|
| | | | | | | | | | | | |
| | Twelve Months Ended
December 31, |
Depreciation and amortization expense: | | 2017 | | 2016 | | 2015 |
| | (In millions) |
U.S. Information Solutions | | $ | 83.7 |
| | $ | 82.1 |
| | $ | 83.3 |
|
International | | 109.9 |
| | 101.6 |
| | 40.1 |
|
Workforce Solutions | | 42.1 |
| | 42.7 |
| | 42.0 |
|
Global Consumer Solutions | | 13.2 |
| | 9.6 |
| | 9.4 |
|
General Corporate | | 38.9 |
| | 29.4 |
| | 23.2 |
|
Total depreciation and amortization expense | | $ | 287.8 |
| | $ | 265.4 |
| | $ | 198.0 |
|
NOTES TO CONSOLIDATED FINANCIAL STATEMENTS
|
| | | | | | | | | | | | |
| | Twelve Months Ended
December 31, |
Capital expenditures: | | 2017 | | 2016 | | 2015 |
| | (In millions) |
U.S. Information Solutions | | $ | 18.6 |
| | $ | 19.1 |
| | $ | 21.9 |
|
International | | 59.7 |
| | 50.3 |
| | 25.7 |
|
Workforce Solutions | | 28.9 |
| | 22.2 |
| | 22.1 |
|
Global Consumer Solutions | | 15.0 |
| | 12.3 |
| | 11.2 |
|
General Corporate | | 91.8 |
| | 87.6 |
| | 69.8 |
|
Total capital expenditures* | | $ | 214.0 |
| | $ | 191.5 |
| | $ | 150.7 |
|
*Amounts above exclude changes in accruals for capital expenditures.
Financial information by geographic area is as follows:
|
| | | | | | | | | | | | | | | | | | | | | |
| | Twelve Months Ended
December 31, |
| | 2017 | | 2016 | | 2015 |
| | | | | | (In millions) | | | | |
Operating revenue (based on location of customer): | | Amount | | % | | Amount | | % | | Amount | | % |
U.S. | | $ | 2,379.7 |
| | 71 | % | | $ | 2,290.9 |
| | 73 | % | | $ | 2,041.7 |
| | 77 | % |
U.K. | | 311.2 |
| | 9 | % | | 232.1 |
| | 7 | % | | 224.1 |
| | 8 | % |
Australia | | 304.0 |
| | 9 | % | | 214.3 |
| | 7 | % | | 5.0 |
| | nm |
|
Canada | | 148.9 |
| | 4 | % | | 134.3 |
| | 4 | % | | 135.5 |
| | 5 | % |
Other | | 218.4 |
| | 7 | % | | 273.3 |
| | 9 | % | | 257.3 |
| | 10 | % |
Total operating revenue | | $ | 3,362.2 |
| | 100 | % | | $ | 3,144.9 |
| | 100 | % | | $ | 2,663.6 |
| | 100 | % |
|
| | | | | | | | | | | | | | |
| | December 31, |
| | 2017 | | 2016 |
| | | | (In millions) | | |
Long-lived assets: | | Amount | | % | | Amount | | % |
U.S. |
| $ | 3,274.5 |
|
| 53 | % |
| $ | 3,282.5 |
|
| 55 | % |
U.K. |
| 303.2 |
|
| 5 | % |
| 278.1 |
|
| 5 | % |
Australia |
| 2,207.1 |
|
| 35 | % |
| 2,061.7 |
|
| 34 | % |
Canada |
| 67.4 |
|
| 1 | % |
| 52.4 |
|
| 1 | % |
Other |
| 382.8 |
|
| 6 | % |
| 316.4 |
|
| 5 | % |
Total long-lived assets |
| $ | 6,235.0 |
|
| 100 | % |
| $ | 5,991.1 |
|
| 100 | % |
14. QUARTERLY FINANCIAL DATA (UNAUDITED)
Quarterly financial data for 2017 and 2016 was as follows:
|
| | | | | | | | | | | | | | | | |
| | Three Months Ended |
2017 | | March 31, | | June 30, | | September 30, | | December 31, |
| | (In millions, except per share data) |
Operating revenue | | $ | 832.2 |
| | $ | 856.7 |
| | $ | 834.8 |
| | $ | 838.5 |
|
Operating income | | $ | 216.8 |
| | $ | 264.1 |
| | $ | 152.9 |
| | $ | 190.9 |
|
Consolidated net income | | $ | 155.4 |
| | $ | 167.6 |
| | $ | 100.5 |
| | $ | 174.4 |
|
Net income attributable to Equifax | | $ | 153.3 |
| | $ | 165.4 |
| | $ | 96.3 |
| | $ | 172.3 |
|
Basic earnings per share* | | |
| | |
| | |
| | |
|
Net income attributable to Equifax | | $ | 1.28 |
| | $ | 1.37 |
| | $ | 0.80 |
| | $ | 1.44 |
|
Diluted earnings per share* | | |
| | |
| | |
| | |
|
Net income attributable to Equifax | | $ | 1.26 |
| | $ | 1.36 |
| | $ | 0.79 |
| | $ | 1.42 |
|
|
| | | | | | | | | | | | | | | | |
| | Three Months Ended |
2016 | | March 31, | | June 30, | | September 30, | | December 31, |
| | (In millions, except per share data) |
Operating revenue | | $ | 728.3 |
| | $ | 811.3 |
| | $ | 804.1 |
| | $ | 801.1 |
|
Operating income | | $ | 176.2 |
| | $ | 225.7 |
| | $ | 212.1 |
| | $ | 203.9 |
|
Consolidated net income | | $ | 102.4 |
| | $ | 133.0 |
| | $ | 134.9 |
| | $ | 124.8 |
|
Net income attributable to Equifax | | $ | 102.1 |
| | $ | 130.9 |
| | $ | 132.8 |
| | $ | 123.0 |
|
Basic earnings per share* | | |
| | |
| | |
| | |
|
Net income attributable to Equifax | | $ | 0.86 |
| | $ | 1.10 |
| | $ | 1.11 |
| | $ | 1.03 |
|
Diluted earnings per share* | | |
| | |
| | |
| | |
|
Net income attributable to Equifax | | $ | 0.85 |
| | $ | 1.08 |
| | $ | 1.09 |
| | $ | 1.01 |
|
| |
* | The sum of the quarterly EPS does not equal the annual EPS due to changes in the weighted-average shares between periods. Other amounts may not equal the annual total due to rounding between periods. |
The comparability of our quarterly financial results during 2017 and 2016 was impacted by certain events, as follows:
| |
• | For the year ended December 31, 2017, we recorded $114.0 million in pretax expenses, with $99.8 million within Selling, General and Administrative expenses and $14.2 million of these expenses in Cost of Services related to the Q3 cybersecurity incident. In addition, as a result of the Tax Act the company recorded preliminary adjustments totaling a net tax benefit of $48.3 million in the fourth quarter of 2017. |
| |
• | For the year ended December 31, 2016, we recorded $40.2 million ($28.2 million, net of tax) for Veda acquisition related amounts. Of this amount, $30.1 million relates to transaction and integration costs in operating income, $9.2 million is recorded in other income and is the impact of foreign currency changes on the transaction structure, including the economic hedges, and $0.7 million is recorded in interest expense. See Note 3 of the Notes to Consolidated Financial Statements. |
ITEM 9. CHANGES IN AND DISAGREEMENTS WITH ACCOUNTANTS ON ACCOUNTING AND FINANCIAL DISCLOSURE
None.
ITEM 9A. CONTROLS AND PROCEDURES
Evaluation of Disclosure Controls and Procedures
Our management, with the participation of our Interim Chief Executive Officer and Chief Financial Officer, evaluated the effectiveness of Equifax’s disclosure controls and procedures as of the end of the period covered by this report. Based on that evaluation, our Interim Chief Executive Officer and Chief Financial Officer concluded that our disclosure controls and procedures as of the end of the period covered by this report (i) were appropriately designed to provide reasonable assurance of achieving their objectives and (ii) were effective and provided reasonable assurance that the information required to be disclosed by Equifax in reports filed under the Exchange Act is (a) recorded, processed, summarized and reported within the time periods specified in the SEC’s rules and forms and (b) accumulated and communicated to Equifax’s management, including our Interim Chief Executive Officer and Chief Financial Officer, as appropriate to allow timely decisions regarding required disclosure.
As discussed in Note 6 of the Notes to the Consolidated Financial Statements in this Form 10-K, on September 7, 2017, we announced a cybersecurity incident. Our review of the circumstances and resulting impact on our internal controls over financial reporting (ICFR) identified two significant deficiencies in our IT General Controls environment, in the third quarter of 2017. As of December 31, 2017, management has remediated the two significant deficiencies.
Incorporating these results, our management, with the participation of our Interim Chief Executive Officer and Chief Financial Officer, evaluated the effectiveness of Equifax's disclosure controls and procedures as of the end of the period covered by this report. Based on that evaluation, our Interim Chief Executive Officer and Chief Financial Officer concluded that our disclosure controls and procedures as of the end of the period covered by this report (i) were appropriately designed to provide reasonable assurance of achieving their objectives and (ii) were effective and provided reasonable assurance that the information required to be disclosed by Equifax in reports filed under the Exchange Act is (a) recorded, processed, summarized and reported within the time periods specified in the SEC's rules and forms and (b) accumulated and communicated to Equifax's management, including our Interim Chief Executive Officer and Chief Financial Officer, as appropriate to allow timely decisions regarding required disclosure.
Management’s Annual Report on Internal Control Over Financial Reporting
Our management is responsible for establishing and maintaining adequate internal control over financial reporting. Internal control over financial reporting is defined in Rules 13a-15(f) and 15d-15(f) under the Exchange Act as a process designed by, or under the supervision of, our Interim Chief Executive Officer and Chief Financial Officer and effected by our Board of Directors, management and other personnel, to provide reasonable assurance regarding the reliability of financial reporting and the preparation of financial statements for external purposes in accordance with generally accepted accounting principles and includes those policies and procedures that:
| |
• | pertain to the maintenance of records that in reasonable detail accurately and fairly reflect transactions and dispositions of our assets; |
| |
• | provide reasonable assurance that transactions are recorded as necessary to permit preparation of financial statements in accordance with generally accepted accounting principles, and that our receipts and expenditures are being made only in accordance with authorizations of our management and directors; and |
| |
• | provide reasonable assurance regarding prevention or timely detection of unauthorized acquisition, use or disposition of our assets that could have a material effect on the financial statements. |
Because of its inherent limitations, internal control over financial reporting may not prevent or detect misstatements. Projections of any evaluation of effectiveness to future periods are subject to the risk that controls may become inadequate because of changes in conditions, or that the degree of compliance with the policies or procedures may deteriorate.
Our management assessed the effectiveness of Equifax’s internal control over financial reporting as of December 31, 2017 using the criteria set forth by the Committee of Sponsoring Organizations of the Treadway Commission (COSO) in Internal Control-Integrated Framework (2013 Framework). Based on this assessment using those criteria, our management concluded that, as of December 31, 2017, Equifax’s internal control over financial reporting was effective. Management
reviewed the results of its assessment with the Audit Committee of its Board of Directors. The effectiveness of Equifax’s internal control over financial reporting as of December 31, 2017 has been audited by Ernst & Young LLP, Equifax’s independent registered public accounting firm, as stated in their report, which appears in Part II, Item 8 of this Form 10-K on page 61.
Changes in Internal Control Over Financial Reporting
There have been no changes in internal control over financial reporting identified in connection with the foregoing that have materially affected, or are reasonably likely to materially affect, our internal control over financial reporting.
ITEM 9B. OTHER INFORMATION
None.
PART III
ITEM 10. DIRECTORS, EXECUTIVE OFFICERS AND CORPORATE GOVERNANCE
Except for the information about our executive officers shown below, the information required by this Item 10 is incorporated herein by reference from the information contained in our Proxy Statement to be filed with the SEC in connection with the solicitation of proxies for our 2018 Annual Meeting of Shareholders (the “2018 Proxy Statement”) under the sections entitled “Proposal 1 Election of Directors,” “Section 16(a) Beneficial Ownership Reporting Compliance” and “Board Leadership and Corporation Governance Committees of the Board of Directors.”
We have adopted a written Code of Ethics and Business Conduct applicable to all our employees, including our principal executive officer, principal financial officer, and principal accounting officer and controller, and to members of our Board of Directors. Our Code of Ethics and Business Conduct is available on our investor relations website: www.equifax.com/about-equifax/corporate-governance. We will disclose amendments to certain provisions of our Code of Ethics and Business Conduct, or waivers of such provisions granted to executive officers and directors, on this website.
Executive Officers
Information regarding the executive officers of Equifax Inc. is set forth below.
J. Dann Adams (60) has been President, Global Consumer Solutions, since November 2015. Prior thereto, he served as President, Workforce Solutions, since July 2010. Prior thereto, he served as President, U.S. Information Solutions from 2007 to June 2010. Prior thereto, he served as Group Executive, North America Information Services from November 2003 until December 2006.
Paulino do Rego Barros, Jr. (61) has been Interim Chief Executive Officer since September 2017. Prior thereto, he led the Company’s Asia-Pacific business since July 2017. Prior thereto, he was President, U.S. Information Solutions, since November 2015. Prior thereto, he served as President, International, since April 2010. Prior thereto, he served as President of PB&C Global Investments, LLC, an international consulting and investment firm. Prior thereto, he was President of Global Operations for AT&T.
Jamil Farshchi (40) was appointed as our Chief Information Security Officer on February 26, 2018. Prior to joining Equifax, Mr. Farshchi served as Chief Information Security Officer at The Home Depot since April 2015. Prior thereto, he was the first Global Chief Information Security Officer at Time Warner Inc., from August 2014 to March 2015. Prior thereto, he was the Vice President of Global Information Security at Visa Inc. from August 2011 to August 2014. Mr. Farshchi has also held senior roles at Los Alamos National Laboratory, Sitel Corporation, Nextwave Broadband and NASA.
John W. Gamble, Jr. (55) has been Corporate Vice President and Chief Financial Officer since May 2014. Prior to that, Mr. Gamble was Executive Vice President and Chief Financial Officer of Lexmark International, Inc., a global provider of document solutions, enterprise content management software and services, printers and multifunction printers, from September 2005 until May 2014.
John T. Hartman (58) has been President, International, since November 2015. Prior thereto, he served as Senior Vice President, Corporate Development, since July 2010. Prior thereto, he served as President of Growth Vector from 2009 to 2010. Prior thereto, he served as Executive Vice President and Chief Commercial Officer for Acuity Brands from 2004 to 2009.
Julia A. Houston (47) has been Chief Transformation Officer since October 2017. Prior thereto, she was Senior Vice President, U.S. Legal, since October 2013. Prior to joining Equifax, Ms. Houston was Senior Vice President, General Counsel and Corporate Secretary at Convergys Corporation, from 2011 to 2013. Prior thereto, she served was Senior Vice President, General Counsel, Chief Compliance Officer and Corporate Secretary at Mirant Corporation, from 2004 to 2010.
John J. Kelley III (57) has been Corporate Vice President and Chief Legal Officer since January 2013. Prior to joining Equifax, Mr. Kelley was a senior partner in the Corporate Practice Group of the law firm of King & Spalding LLP from January 1993 to December 2012.
Nuala M. King (64) has been Senior Vice President and Controller since May 2006. Prior thereto, she was Vice President and Corporate Controller from March 2004 to April 2006. Prior to joining Equifax, Ms. King served as Corporate Controller for UPS Capital from March 2001 until March 2004.
Joseph M. Loughran, III (50) has been President, U.S. Information Solutions, since July 2017. Prior thereto, he was Chief Marketing Officer since March 2015. Prior thereto, he served as President, Global Consumer Solutions since January 2010. Prior thereto, he was Senior Vice President Corporate Development from April 2006 to December 2009. Prior to joining Equifax, he held various executive roles at BellSouth Corporation from May 2001 to April 2006, including most recently Managing Director Corporate Strategy and Planning from May 2005 to April 2006.
Rodolfo O. Ploder (57) has been President, Workforce Solutions, since November 2015. Prior thereto, he served as President, U.S. Information Solutions, since April 2010. Prior thereto, he served as President, International, from January 2007 to April 2010. Prior thereto, he was Group Executive, Latin America from February 2004 to January 2007.
Coretha M. Rushing (61) has been Corporate Vice President and Chief Human Resources Officer since 2006. Prior to joining Equifax, she served as an executive coach and HR Consultant with Atlanta-based Cameron Wesley LLC. Prior thereto, she was Senior Vice President of Human Resources at The Coca-Cola Company, where she was employed from 1996 until 2004.
Laura L. Wilbanks (50) has been Chief Marketing Officer since August 2017. Prior thereto, she served as Senior Vice President and Senior Marketing Officer for U.S. Information Solutions, since May 2013. Prior thereto, she served as Senior Vice President, Strategic Marketing since January 2010. Prior thereto, since February 1998, Ms. Wilbanks held positions of increasing responsibility at Equifax, including leadership roles in global product management, global strategy, market development and market insight and planning.
ITEM 11. EXECUTIVE COMPENSATION
The information required by this Item 11 is incorporated herein by reference from the information contained in our 2018 Proxy Statement under the sections entitled “Executive Compensation” and “Director Compensation.”
ITEM 12. SECURITY OWNERSHIP OF CERTAIN BENEFICIAL OWNERS AND MANAGEMENT AND RELATED STOCKHOLDER MATTERS
The information required by this Item 12 is incorporated herein by reference from the information contained in our 2018 Proxy Statement under the sections entitled “Security Ownership of Management and Certain Beneficial Owners” and “Executive Compensation Equity Compensation Plan Information.”
ITEM 13. CERTAIN RELATIONSHIPS AND RELATED TRANSACTIONS AND DIRECTOR INDEPENDENCE
The information required by this Item 13 is incorporated herein by reference from the information contained in our 2018 Proxy Statement under the sections entitled “Board Leadership and Corporate Governance Director Independence, ” “Related Person Transaction Policy” and “Certain Relationships and Related Person Transactions of Directors, Executive Officers, and 5 Percent Shareholders.”
ITEM 14. PRINCIPAL ACCOUNTANT FEES AND SERVICES
The information required by this Item 14 is incorporated herein by reference from the information contained in our 2018 Proxy Statement under the section entitled “Proposal 3 Ratification of Appointment of Ernst & Young LLP as Independent Registered Public Accounting Firm for 2018.”
PART IV
ITEM 15. EXHIBITS AND FINANCIAL STATEMENT SCHEDULES
| |
(a) | List of Documents Filed as a Part of This Report: |
| |
(1) | Financial Statements. The following financial statements are included in Item 8 of Part II: |
| |
• | Consolidated Balance Sheets — December 31, 2017 and 2016; |
| |
• | Consolidated Statements of Income for the Years Ended December 31, 2017, 2016 and 2015; |
| |
• | Consolidated Statements of Comprehensive Income for the Years Ended December 31, 2017, 2016 and 2015; |
| |
• | Consolidated Statements of Cash Flows for the Years Ended December 31, 2017, 2016 and 2015; |
| |
• | Consolidated Statements of Shareholders’ Equity and Other Comprehensive Income for the Years Ended December 31, 2017, 2016 and 2015; and |
| |
• | Notes to Consolidated Financial Statements. |
| |
(2) | Financial Statement Schedules. |
•Schedule II — Valuation and Qualifying Accounts
All other schedules for which provision is made in the applicable accounting regulation of the SEC are not required under the related instructions or are inapplicable and, therefore, have been omitted.
| |
(3) | Exhibits. See exhibits listed under Part (b) below. |
(b) Exhibits:
|
| | |
Exhibit Number | | Description |
| | |
| | Plan of Acquisition |
2.1 | | |
| | |
| | Articles of Incorporation and Bylaws |
| | |
3.1 | | |
3.2 | | |
| | |
| | Instruments Defining the Rights of Security Holders, Including Indentures |
| | |
4.1 | | |
4.2 | | |
4.3 | | |
4.4 | | |
4.5 | | |
|
| | |
4.6 | | |
4.7 | | |
4.8 | | |
| | |
| | Except as set forth in the preceding Exhibits 4.1 through 4.8, instruments defining the rights of holders of long-term debt securities of Equifax have been omitted where the total amount of securities authorized does not exceed 10% of the total assets of Equifax and its subsidiaries on a consolidated basis. Equifax agrees to furnish to the SEC, upon request, a copy of such instruments with respect to issuances of long-term debt of Equifax and its subsidiaries. |
| | |
| | Management Contracts and Compensatory Plans or Arrangements |
| | |
10.1 | | |
10.2 | | |
10.3 | | |
10.4 | | |
10.5 | | |
10.6 | | |
10.7 | | |
10.8 | | |
10.9 | | |
10.10 | | |
10.11 | | |
10.12 | | |
10.13 | | |
10.14 | | |
10.15 | | |
10.16 | | |
|
| | |
10.17 | | |
10.18 | | |
10.19 | | |
10.20 | | |
10.21 | | |
10.22 | | |
10.23 | | |
10.24 | | |
10.25 | | |
10.26 | | |
10.27* | | |
10.28 | | |
10.29 | | |
10.30 | | |
10.31 | | |
10.32 | | |
10.33 | | |
10.34 | | |
10.35 | | |
10.36 | | |
10.37 | | |
10.38 | | |
|
| | |
10.39 | | |
| | |
| | Material Contracts |
| | |
10.40 | | |
10.41 | | |
| | |
| | Other Exhibits and Certifications |
| | |
11.1 | | |
12.1* | | |
21.1* | | |
23.1* | | |
24.1* | | |
31.1* | | |
31.2* | | |
32.1* | | |
32.2* | | |
101.INS | | XBRL Instance Document. |
101.SCH | | XBRL Taxonomy Extension Schema Document. |
101.CAL | | XBRL Taxonomy Extension Calculation Linkbase. |
101.LAB | | XBRL Taxonomy Extension Label Linkbase. |
101.PRE | | XBRL Taxonomy Extension Presentation Linkbase. |
101.DEF | | XBRL Taxonomy Extension Definition Linkbase. |
| | |
* Filed herewith
(c) Financial Statement Schedules. See Item 15(a)(2).
ITEM 16. FORM 10-K SUMMARY
None.
SIGNATURES
Pursuant to the requirements of Section 13 or 15(d) of the Securities Exchange Act of 1934, the registrant has duly caused this report to be signed on its behalf by the undersigned, thereunto duly authorized, on March 1, 2018.
|
| |
| EQUIFAX INC. |
| (Registrant) |
| |
By: | /s/ Paulino R. Barros, Jr. |
| Paulino R. Barros, Jr. |
| Interim Chief Executive Officer |
We, the undersigned directors and executive officers of Equifax Inc., hereby severally constitute and appoint John W. Gamble, Jr. and Nuala M. King, and each of them singly, our true and lawful attorneys with full power to them and each of them to sign for us, and in our names in the capacities indicated below, any and all amendments to this Annual Report on Form 10-K filed with the SEC, hereby ratifying and confirming our signatures as they may be signed by our said attorneys to any and all amendments to said Annual Report on Form 10-K.
Pursuant to the requirements of the Securities Exchange Act of 1934, this report has been signed below by the following persons on behalf of the registrant and in the capacities indicated on March 1, 2018.
|
| |
/s/ Paulino R. Barros, Jr. | |
Paulino R. Barros, Jr. | |
Interim Chief Executive Officer | |
(Principal Executive Officer) | |
| |
/s/ John W. Gamble, Jr. | |
John W. Gamble, Jr. | |
Corporate Vice President and Chief Financial Officer | |
(Principal Financial Officer) | |
| |
/s/ Nuala M. King | |
Nuala M. King | |
Senior Vice President and Corporate Controller | |
(Principal Accounting Officer) | |
| |
/s/ Mark L. Feidler | |
Mark L. Feidler | |
Director and Chairman | |
| |
/s/ Robert D. Daleo | |
Robert D. Daleo | |
Director | |
| |
/s/ Walter W. Driver, Jr. | |
Walter W. Driver, Jr. | |
Director | |
| |
/s/ G. Thomas Hough | |
G. Thomas Hough | |
Director | |
| |
/s/ L. Phillip Humann | |
L. Phillip Humann | |
Director | |
| |
/s/ Robert D. Marcus | |
Robert D. Marcus | |
Director | |
| |
/s/ Siri S. Marshall | |
Siri S. Marshall | |
Director | |
|
| |
| |
/s/ Scott A. McGregor | |
Scott A. McGregor | |
Director | |
| |
/s/ John A. McKinley | |
John A. McKinley | |
Director | |
| |
/s/ Elane B. Stock | |
Elane B. Stock | |
Director | |
| |
/s/ Mark B. Templeton | |
Mark B. Templeton | |
Director | |
SCHEDULE II — VALUATION AND QUALIFYING ACCOUNTS
2017
|
| | | | | | | | | | | | | | | | | | | | |
Column A | | Column B | | Column C | | Column D | | Column E |
| | | | Additions | | | | |
Description | | Balance at Beginning of Period | | Charged to Costs and Expenses | | Charged to Other Accounts | | Deductions | | Balance at End of Period |
| | (In millions) |
Reserves deducted in the balance sheet from the assets to which they apply: | | |
| | |
| | |
| | |
| | |
|
Trade accounts receivable | | $ | 7.8 |
| | $ | 5.0 |
| | $ | — |
| | $ | (3.7 | ) | | $ | 9.1 |
|
Deferred income tax asset valuation allowance | | 307.3 |
| | (6.1 | ) | | 8.1 |
| | 92.5 |
| | 401.8 |
|
| | $ | 315.1 |
| | $ | (1.1 | ) | | $ | 8.1 |
| | $ | 88.8 |
| | $ | 410.9 |
|
2016
|
| | | | | | | | | | | | | | | | | | | | |
Column A | | Column B | | Column C | | Column D | | Column E |
| | | | Additions | | | | |
Description | | Balance at Beginning of Period | | Charged to Costs and Expenses | | Charged to Other Accounts | | Deductions | | Balance at End of Period |
| | (In millions) |
Reserves deducted in the balance sheet from the assets to which they apply: | | |
| | |
| | |
| | |
| | |
|
Trade accounts receivable | | $ | 7.5 |
| | $ | 2.2 |
| | $ | — |
| | $ | (1.9 | ) | | $ | 7.8 |
|
Deferred income tax asset valuation allowance | | 222.9 |
| | (233.7 | ) | | 23.8 |
| | 294.3 |
| | 307.3 |
|
| | $ | 230.4 |
| | $ | (231.5 | ) | | $ | 23.8 |
| | $ | 292.4 |
| | $ | 315.1 |
|
2015
|
| | | | | | | | | | | | | | | | | | | | |
Column A | | Column B | | Column C | | Column D | | Column E |
| | | | Additions | | | | |
Description | | Balance at Beginning of Period | | Charged to Costs and Expenses | | Charged to Other Accounts | | Deductions | | Balance at End of Period |
| | (In millions) |
Reserves deducted in the balance sheet from the assets to which they apply: | | |
| | |
| | |
| | |
| | |
|
Trade accounts receivable | | $ | 7.2 |
| | $ | 4.3 |
| | $ | — |
| | $ | (4.0 | ) | | $ | 7.5 |
|
Deferred income tax asset valuation allowance | | 121.4 |
| | (1.5 | ) | | (13.0 | ) | | 116.0 |
| | 222.9 |
|
| | $ | 128.6 |
| | $ | 2.8 |
| | $ | (13.0 | ) | | $ | 112.0 |
| | $ | 230.4 |
|